NEETS Module 9 − Introduction to Wave− Generation and Wave−Shaping
Pages i,
1−1,
1−11,
1−21,
1−31,
1−41,
2−1,
2−11,
2−21,
2−31,
3−1,
3−11,
3−21,
3−31,
3−41,
3−51,
4−1,
4−11,
4−21,
4−31,
4−41,
4−51, Index
| - |
Matter, Energy,
and Direct Current |
| - |
Alternating Current and Transformers |
| - |
Circuit Protection, Control, and Measurement |
| - |
Electrical Conductors, Wiring Techniques,
and Schematic Reading |
| - |
Generators and Motors |
| - |
Electronic Emission, Tubes, and Power Supplies |
| - |
Solid-State Devices and Power Supplies |
| - |
Amplifiers |
| - |
Wave-Generation and Wave-Shaping Circuits |
| - |
Wave Propagation, Transmission Lines, and
Antennas |
| - |
Microwave Principles |
| - |
Modulation Principles |
| - |
Introduction to Number Systems and Logic Circuits |
| - |
- Introduction to Microelectronics |
| - |
Principles of Synchros, Servos, and Gyros |
| - |
Introduction to Test Equipment |
| - |
Radio-Frequency Communications Principles |
| - |
Radar Principles |
| - |
The Technician's Handbook, Master Glossary |
| - |
Test Methods and Practices |
| - |
Introduction to Digital Computers |
| - |
Magnetic Recording |
| - |
Introduction to Fiber Optics |
| Note: Navy Electricity and Electronics Training
Series (NEETS) content is U.S. Navy property in the public domain. |
T = 1 x 10⁻⁵ vor 10 microseconds
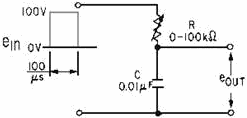
Figure 4-35. - RC integrator circuit.
Since the time constant of the circuit is 10 microseconds and the pulse duration
is 100 microseconds, the time constant is short (1/10 of the pulse duration). The
capacitor is charged exponentially through the resistor. In 5 time constants, the
capacitor will be, for all practical purposes, completely charged. At the first
time constant, the capacitor is charged to 63.2 volts, at the second 86.5 volts,
at the third 95 volts, at the fourth 98 volts, and finally at the end of the fifth
time constant (50 microseconds), the capacitor is fully charged. This is shown in
figure 4-36.
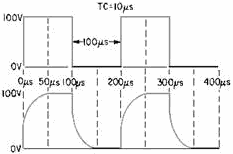
Figure 4-36. - Square wave applied to a short time-constant integrator.
Notice that the leading edge of the square wave taken across the capacitor is
rounded. If the time constant were made extremely short, the rounded edge would
become square.
Medium Time-Constant Integrator
The time constant, in figure 4-36 can be changed by increasing the value of the
variable resistor
(figure 4-35) to 10,000 ohms. The time constant will then be equal to 100 microseconds.
This time constant is known as a medium time constant. Its value lies between
the extreme ranges of the short and long time constants. In this case, its value
happens to be exactly equal to the duration of the input pulse, 100 microseconds.
The output waveform, after several time constants, is shown in figure
4-41
4-37. The long, sloping rise and fall of voltage is caused by the inability of
the capacitor to charge and discharge rapidly through the 10,000-ohm series resistance.
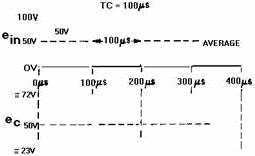
Figure 4-37. - Medium time-constant integrator.
At the first instant of time, 100 volts is applied to the medium time-constant
circuit. In this circuit, 1TC is exactly equal to the duration of the input pulse.
After 1TC the capacitor has charged to 63.2 percent of the input voltage (100 volts).
Therefore, at the end of 1TC (100 microseconds), the voltage across the capacitor
is equal to 63.2 volts. However, as soon as 100 microseconds has elapsed, and the
initial charge on the capacitor has risen to 63.2 volts, the input voltage suddenly
drops to 0. It remains
there for 100 microseconds. The capacitor will now discharge for 100 microseconds.
Since the discharge time is 100 microseconds (1TC), the capacitor will discharge
63.2 percent of its total 63.2-volt charge, a value of 23.3 volts. During the next
100 microseconds, the input voltage will increase from 0 to 100 volts instantaneously.
The capacitor will again charge for 100 microseconds (1TC). The voltage available
for this charge is the difference between the voltage applied and the charge on
the capacitor (100 - 23.3 volts), or 76.7 volts. Since the capacitor will only be
able to charge for 1TC, it will charge to 63.2 percent of the 76.7 volts, or 48.4
volts. The total charge on the capacitor at the end of 300 microseconds will be
23.3 + 48.4 volts, or 71.7 volts.
Notice that the capacitor voltage at the end of 300 microseconds is greater than
the capacitor voltage at the end of 100 microseconds. The voltage at the end of
100 microseconds is 63.2 volts, and the capacitor voltage at the end of 300 microseconds
is 71.7 volts, an increase of 8.5 volts.
The output waveform in this graph (eC) is the waveform that will be produced
after many cycles of input signal to the integrator. The capacitor will charge and
discharge in a step-by-step manner until it finally charges and discharges above
and below a 50-volt level. The 50-volt level is controlled by the maximum amplitude
of the symmetrical input pulse, the average value of which is 50 volts.
Long Time-Constant Integrator
If the resistance in the circuit of figure 4-35 is increased to 100,000 ohms,
the time constant of the circuit will be 1,000 microseconds. This time constant
is 10 times the pulse duration of the input pulse. It is, therefore, a long time-constant
circuit.
The shape of the output waveform across the capacitor is shown in figure 4-38.
The shape of the output waveform is characterized by a long, sloping rise and fall
of capacitor voltage.
4-42
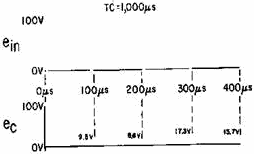
Figure 4-38. - Square wave applied to a long time-constant integrator.
At the first instant of time, 100 volts is applied to the long time-constant
circuit. The value of charge on the capacitor at the end of the first 100 microseconds
of the input signal can be found by using the Universal Time Constant Chart (figure
4-34). Assume that a line is projected up from the point on the base line corresponding
to 0.1TC. The line will intersect the curve at a point that is the percentage of
voltage across the capacitor at the end of the first 100 microseconds. Since the
applied voltage is 100 volts, the charge on the capacitor at the end of the first
100 microseconds will be approximately 9.5 volts. At the end of the first 100 microseconds,
the input signal will fall suddenly to 0 and the capacitor will begin to discharge.
It will be able to discharge for 100 microseconds. Therefore, the capacitor will
discharge 9.5 percent of its accumulated 9.5 volts (.095 ´ 9.5 = 0.90 volt). The
discharge of the 0.90 volt will result in a remaining charge on the capacitor of
8.6 volts. At the end of 200 microseconds, the input signal will again suddenly
rise to a value of 100 volts. The capacitor will be able to charge to 9.5 percent
of the difference (100 - 8.6 = 91.4 volts). This may also be figured as a value
of 8.7 volts plus the initial 8.6 volts. This results in a total charge on the capacitor
(at the end of the first 300 microseconds) of 8.7 + 8.6 = 17.3 volts.
Notice that the capacitor voltage at the end of the first 300 microseconds is
greater than the capacitor voltage at the end of the first 100 microseconds. The
voltage at the end of the first 100 microseconds is 9.5 volts; the capacitor voltage
at the end of the first 300 microseconds is 17.3 volts, an increase of 7.8 volts.
The capacitor charges and discharges in this step-by-step manner until, finally,
the capacitor charges and discharges above and below a 50-volt level. The 50-volt
level is controlled by the maximum amplitude of the square-wave input pulse, the
average value of which is 50 volts.
Q21. What is the numerical difference (in terms of the time constant)
between a long and a short time- constant circuit?
Q22. What would happen to the integrator output if the capacitor
were made extremely large (all other factors remaining the same)?
DIFFERENTIATORS
DIFFERENTIATION is the direct opposite of integration. In the RC integrator,
the output is taken from the capacitor. In the differentiator, the output is taken
across the resistor. Likewise, this means that when the RL circuit is used as a
differentiator, the differentiated output is taken across the inductor.
4-43
An application of Kirchhoff's law shows the relationship between the waveforms
across the resistor and capacitor in a series network. Since the sum of the voltage
drops in a closed loop must equal the total applied voltage, the graphical sum of
the voltage waveforms in a closed loop must equal the applied waveform. Figure 4-39
shows a differentiator circuit with the output taken across a variable resistor.
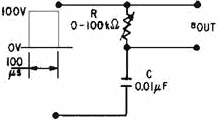
Figure 4-39. - RC circuit as a differentiator.
Short Time-Constant Differentiator
With the variable resistor set at 1,000 ohms and the capacitor value of 0.01
microfarad, the time constant of the circuit is 10 microseconds. Since the input
waveform has a duration of 100 microseconds, the circuit is a short time-constant
circuit.
At the first instant of time in the short time-constant circuit, the voltage
across the capacitor is 0. Current flows through the resistor and causes a maximum
voltage to be developed across it. This is shown at the first instant of time in
the graph of figure 4-40.
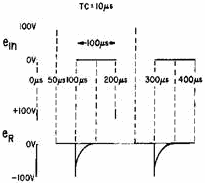
Figure 4-40. - Square wave applied to a short time-constant differentiator.
As the capacitor begins accumulating a charge, the voltage developed across the
resistor will begin to decrease. At the end of the first time constant, the voltage
developed across the resistor will have decreased by a value equal to 63.2 percent
of the applied voltage. Since 100 volts is applied, the voltage across the resistor
after 1TC will be equal to 36.8 volts. After the second time constant, the voltage
across the resistor will be down to 13.5 volts. At the end of the third time constant,
eR will be 5 volts and at the
4-44
end of the fourth time constant, 2 volts. At the end of the fifth time constant,
the voltage across the resistor will be very close to 0 volts. Since the time constant
is equal to 10 microseconds, it will take a total of 50 microseconds to completely
charge the capacitor and stop current flow in the circuit.
As shown in figure 4-40 the slope of the charge curve will be very sharp. The
voltage across the resistor will remain at 0 volts until the end of 100 microseconds.
At that time, the applied voltage suddenly drops to 0, and the capacitor will now
discharge through the resistor. At this time, the discharge current will be maximum
causing a large discharge voltage to develop across the resistor. This is shown
as the negative spike in figure 4-40. Since the current flow from the capacitor,
which now acts like a source, is decreasing exponentially, the voltage across the
resistor will also decrease. The resistor voltage will decrease exponentially to
0 volts in 5 time constants. All of this discharge action will take a total of 50
microseconds. The discharge curve is also shown in figure 4-40. At the end of 200
microseconds, the action begins again. The output waveform taken across the resistor
in this short time-constant circuit is an example of differentiation. With the square
wave applied, positive and negative spikes are produced in the output. These spikes
approximate the rate of change of the input square wave.
Medium Time-Constant Differentiator
The output across the resistor in an RC circuit of a medium time constant is
shown in figure 4-41. The value of the variable resistor has been increased to a
value of 10,000 ohms. This means that the time constant of the circuit is equal
to the duration of the input pulse or 100 microseconds. For clarity, the voltage
waveforms developed across both the resistor and the capacitor are shown. As before,
the sum of the voltages across the resistor and capacitor must be equal to the applied
voltage of 100 volts.
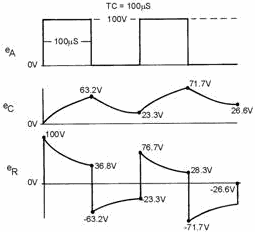
Figure 4-41. - Voltage outputs in a medium time-constant differentiator.
At the first instant of time, a pulse of 100 volts in amplitude with a duration
of 100 microseconds is applied. Since the capacitor cannot respond quickly to the
change in voltage, all of the applied voltage is felt across the resistor. Figure
4-41 shows the voltage across the resistor (eR) to be 100 volts and the
voltage across the capacitor (eC) to be 0 volts. As time progresses,
the capacitor charges. As the capacitor voltage increases, the resistor voltage
decreases. Since the time that the capacitor is permitted to charge is 100 microseconds
(equal to 1TC in this circuit), the capacitor will charge to 63.2 percent of the
applied
4-45
voltage at the end of 1TC, or 63.2 volts. Because Kirchhoff's law must be followed
at all times, the voltage across the resistor must be equal to the difference between
the applied voltage and the charge on the capacitor (100 - 63.2 volts), or 36.8
volts.
At the end of the first 100 microseconds, the input voltage suddenly drops to
0 volts. The charge on the capacitor (-63.2 volts) becomes the source and the entire
voltage is developed across the resistor for the first instant.
The capacitor discharges during the next 100 microseconds. The voltage across
the resistor decreases at the same rate as the capacitor voltage and total voltage
is maintained at 0. This exponential decrease in resistor voltage is shown during
the second 100 microseconds in figure 4-41. The capacitor will discharge 63.2 percent
of its charge to a value of 23.3 volts at the end of the second 100 microseconds.
The resistor voltage will rise in the positive direction to a value of -23.3 volts
to maintain the total voltage at 0 volts.
At the end of 200 microseconds, the input voltage again rises suddenly to 100
volts. Since the capacitor cannot respond to the 100-volt increase instantaneously,
the 100-volt change takes place across the resistor. The voltage across the resistor
suddenly rises from -23.3 volts to +76.7 volts. The capacitor will now begin to
charge for 100 microseconds. The voltage will decrease across the resistor. This
charge and discharge action will continue for many cycles. Finally, the voltage
across the capacitor will rise and fall by equal amounts both above and below about
a 50-volt level. The resistor voltage will also rise and fall by equal amounts to
about a 0-volt level.
Long Time-Constant Differentiator
If the time constant for the circuit in figure 4-39 is increased to make it a
long time-constant circuit, the differentiator output will appear more like the
input. The time constant for the circuit can be changed by either increasing the
value of capacitance or resistance. In this circuit, the time constant will be increased
by increasing the value of resistance from 10,000 ohms to 100,000 ohms. Increasing
the value of resistance will result in a time constant of 1,000 microseconds. The
time constant is 10 times the duration of the input pulse. The output of this long
time-constant circuit is shown in figure 4-42.
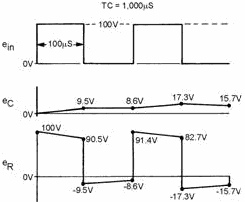
Figure 4-42. - Voltage outputs in a long time-constant differentiator.
4-46
At the first instant of time, a pulse of 100-volts amplitude with a duration
of 100 microseconds is applied. Since the capacitor cannot respond instantaneously
to a change in voltage, all of the applied voltage is felt across the resistor.
As time progresses, the capacitor will charge and the voltage across the resistor
will be reduced. Since the time that the capacitor is permitted to charge is 100
microseconds, the capacitor will charge for only 1/10 of 1TC or to 9.5 percent of
the applied voltage. The voltage across the resistor must be equal to the difference
between the applied voltage and the charge on the capacitor (100 - 9.5 volts), or
90.5 volts.
At the end of the first 100 microseconds of input, the applied voltage suddenly
drops to 0 volts, a change of 100 volts. Since the capacitor is not able to respond
to so rapid a voltage change, it becomes the source of 9.5 volts. This causes a
-9.5 voltage to be felt across the resistor in the first instant of time. The sum
of the voltage across the two components is now 0 volts.
During the next 100 microseconds, the capacitor discharges. The total circuit
voltage is maintained at 0 by the voltage across the resistor decreasing at exactly
the same rate as the capacitor discharge. This exponential decrease in resistor
voltage is shown during the second 100 microseconds of operation. The capacitor
will now discharge 9.5 percent of its charge to a value of 8.6 volts. At the end
of the second 100 microseconds, the resistor voltage will rise in a positive direction
to a value of -8.6 volts to maintain the total circuit voltage at 0 volts.
At the end of 200 microseconds, the input voltage again suddenly rises to 100
volts. Since the capacitor cannot respond to the 100-volt change instantaneously,
the 100-volt change takes place across the resistor. This step-by-step action will
continue until the circuit stabilizes. After many cycles have passed, the capacitor
voltage varies by equal amounts above and below the 50-volt level. The resistor
voltage varies by equal amounts both above and below a 0-volt level.
The RC networks which have been discussed in this chapter may also be used as
coupling networks. When an RC circuit is used as a coupling circuit, the output
is taken from across the resistor. Normally, a long time-constant circuit is used.
This, of course, will cause an integrated wave shape across the capacitor if the
applied signal is nonsinusoidal. However, in a coupling circuit, the signal across
the resistor should closely resemble the input signal and will if the time constant
is sufficiently long. By referring to the diagram in figure 4-42, you can see that
the voltage across the resistor closely resembles the input signal. Consider what
would happen if a pure sine wave were applied to a long time-constant RC circuit
(R is much greater than XC). a large percentage of the applied voltage
would be developed across the resistor and only a small amount across the capacitor.
Q23. What is the difference between an RC and an RL differentiator
in terms of where the output is developed?
COUNTERS
A counting circuit receives uniform pulses representing units to be counted.
It provides a voltage that is proportional to the frequency of the units.
With slight modification, the counting circuit can be used with a blocking oscillator
to produce trigger pulses which are a submultiple of the frequency of the pulses
applied. In this case the circuit acts as a frequency divider.
The pulses applied to the counting circuit must be of the same time duration
if accurate frequency division is to be made. Counting circuits are generally preceded
by shaping circuits and limiting circuits (both discussed in this chapter) to ensure
uniformity of amplitude and pulse width. Under those conditions, the pulse repetition
frequency is the only variable and frequency variations may be measured.
4-47
Q24. Name a common application of counting circuits.
Positive Counters
The Positive-DIODE COUNTER circuit is used in timing or counting circuits in
which the number of input pulses are represented by the output voltage. The output
may indicate frequency, count the rpm of a shaft, or register a number of operations.
The counter establishes a direct relationship between the input frequency and the
average dc output voltage. As the input frequency increases, the output voltage
also increases; conversely, as the input frequency decreases, the output voltage
decreases. In effect, the positive counter counts the number of positive input pulses
by producing an average dc output voltage proportional to the repetition frequency
of the input signal. For accurate counting, the pulse repetition frequency must
be the only variable parameter in the input signal. Therefore, careful shaping and
limiting of the input signal is essential for you to ensure that the pulses are
of uniform width and that the amplitude is constant. When properly filtered and
smoothed, the dc output voltage of the counter may be used to operate a direct reading
indicator.
Solid-state and electron-tube counters operate in manners similar to each other.
The basic solid-state (diode) counter circuit is shown in view (A) of figure 4-43.
Capacitor C1 is the input coupling capacitor. Resistor R1 is the load resistor across
which the output voltage is developed. For the purpose of circuit discussion, assume
that the input pulses (shown in view (B)) are of constant amplitude and time duration
and that only the pulse repetition frequency changes. At time T0, the positive-going
input pulse is applied to C1 and causes the anode of D2 to become positive. D2 conducts
and current ic flows through R1 and D2 to charge C1. Current ic,
develops an output voltage across R1, shown as eout.
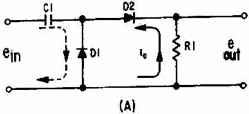
Figure 4-43A. - Positive-diode counter and waveform.
4-48
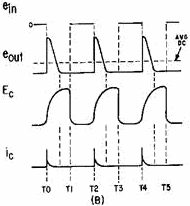
Figure 4-43B. - Positive-diode counter and waveform.
The initial heavy flow of current produces a large voltage across R1 which tapers
off exponentially as C1 charges. The charge on C1 is determined by the time constant
of R1 and the conducting resistance of the diode times the capacitance of C1. For
ease of explanation, assume that C1 is charged to the peak value before T1.
At T1 the input signal reverses polarity and becomes negative-going. Although
the charge on capacitor C1 cannot change instantly, the applied negative voltage
is equal to or greater than the charge on C1. This causes the anode of D2 to become
negative and conduction ceases. When D2 stops conducting eout is at 0.
C1 quickly discharges through D1 since its cathode is now negative with respect
to ground. Between T1 and T2 the input pulse is again at the 0-volt level and D2
remains in a nonconducting state. Since the very short time constant provided by
the conduction resistance of D1 and C1 is so much less than the long time constant
offered by D2 and R1 during the conduction period, C1 is always completely discharged
between pulses. Thus, for each input pulse, a precise level of charge is deposited
on C1. For each charge of C1 an identical output pulse is produced by the flow of
ic through R1. Since this current flow always occurs in the direction indicated
by the solid arrow, the dc output voltage is positive.
At T2 the input signal again becomes positive and the cycle repeats. The time
duration between pulses is the interval represented by the period between T1 and
T2 or between T3 and T4. If the input- pulse frequency is reduced, these time periods
become longer. On the other hand, if the frequency is increased, these time intervals
become shorter. With shorter periods, more pulses occur in a given length of time
and a higher average dc output voltage is produced; with longer periods, fewer pulses
occur and a lower average dc output voltage is produced. Thus, the dc output is
directly proportional to the repetition frequency of the input pulses. If the current
and voltage are sufficiently large, a direct-reading meter can be used to indicate
the count. If they are not large enough to actuate a meter directly, a dc amplifier
may be added. In the latter case, a pi-type filter network is inserted at the output
of R1 to absorb the instantaneous pulse variations and produce a smooth direct current
for amplification.
From the preceding discussion, you should see that the voltage across the output
varies in direct proportion to the input pulse repetition rate. Hence, if the repetition
rate of the incoming pulses increases, the voltage across R1 also increases. For
the circuit to function as a frequency counter, some method must
4-49
be employed to use this frequency-to-voltage relationship to operate an indicator.
The block diagram in view (A) of figure 4-44 represents one simple circuit which
may be used to perform this function. In this circuit, the basic counter is fed
into a low-pass filter and an amplifier with a meter that is calibrated in units
of frequency.
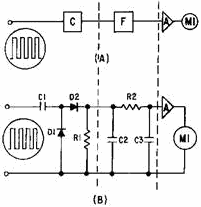
Figure 4-44. - Basic frequency counter.
A typical schematic diagram is shown in view (B). The positive pulses from the
counter are filtered by C2, R2, and C3. The positive dc voltage from the filter
is applied to the input of amplifier A. This voltage increases with frequency; as
a consequence, the current through the device increases. Since emitter or cathode
current flows through M1, an increase in amplifier current causes an increase in
meter deflection. The meter may be calibrated in units of time, frequency, revolutions
per minute, or any function based upon the relationship of output voltage to input
frequency.
Q25. What establishes the value of the current that flows in the
output of figure 4-43?
Q26. What is the purpose of D1 in figure 4-43?
Negative Counters
Reversing the connections of diodes D1 and D2 in the positive-counter circuit
(view (A) of figure 4- 43) will cause the circuit to respond to negative pulses
and become a negative-counter circuit. Diode D2 conducts during the time the negative
pulse is applied and current flows in the opposite direction through R1, as was
indicated by the arrow. At the end of the negative pulse, D1 conducts and discharges
C1. The current through R1 increases with an increase in pulse frequency as before.
However, if the voltage developed across R1 is applied to the same control circuit,
as shown in view (A) of figure 4-44, the increase in current will be in a negative
direction and the amplifier will conduct less. Thus, the effect is opposite to that
of the positive counter.
Step-by-Step (Step) Counters
The STEP-BY-STEP (STEP) COUNTER is used as a voltage multiplier when a stepped
voltage must be provided to any device which requires such an input. The step counter
provides an output which increases in one-step increments for each cycle of the
input. At some predetermined level, the output voltage reaches a point which causes
a circuit, such as a blocking oscillator, to be triggered.
4-50
|


