Module 16 - Introduction to Test Equipment
Pages i,
1-1,
1-11,
1-21,
2-1,
2-11,
2-21,
3-1,
3-11,
3-21,
3-31,
4-1,
4-11,
4-21,
5-1,
5-11,
5-21,
5-31,
6-1,
6-11,
6-21,
6-31,
6-41, Index
divided into the basic sections shown in figure 6-13: (1) a CRT, (2) a group of control circuits that control
the waveform fed to the CRT, (3) a power supply, (4) sweep circuitry, and (5) deflection circuitry.
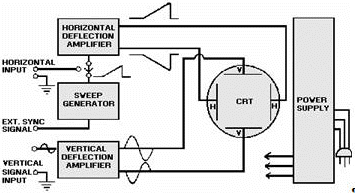
Figure 6-13. - Block diagram of an oscilloscope. Q-14. List the circuits that all oscilloscopes have in common. Figure 6-14 is a drawing of the
front panel of a dual-trace, general-purpose oscilloscope. Oscilloscopes vary greatly in the number of controls
and connectors. Usually, the more controls and connectors, the more versatile the instrument. Regardless of the
number, all oscilloscopes have similar controls and connectors. Once you learn the fundamental operation of these
common controls, you can move with relative ease from one model of oscilloscope to another. Occasionally, controls
that serve similar functions will be labeled differently from one model to another. However, you will find that
most controls are logically grouped and that their names usually indicate their function.
6-11
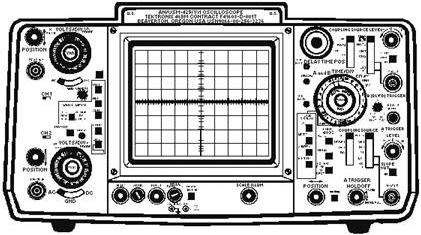
Figure 6-14. - Dual-trace oscilloscope. The oscilloscope in figure 6-14 is called DUAL-TRACE because it can accept and display two vertical
signal inputs at the same time - usually for comparison of the two signals or one signal and a reference signal.
This scope can also accept just one input. In this case, it is used as a Single-TRACE OSCILLOSCOPE. For the
following discussion, we will consider this to be a single-trace oscilloscope. The oscilloscope in the figure is
commonly used in the fleet. You are likely to use this one (model AN/USM-425) or one very similar to it. Let's now
look at the front panel controls.
COMPONENTS useD to DIsPLAY The WAVEforM The CRT DIsPLAY SCREEN is used to display the
signal (figure 6-15). It allows you to make accurate measurements using the vertical and horizontal graticules, as
discussed earlier.
6-12
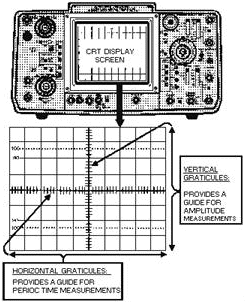
Figure 6-15. - CRT display and graticule. COMPONENTS useD to ADJUST CRT DIsPLAY QUALITY The controls in figure 6-16 allow
you to adjust for a clear signal display. They also allow you to adjust the display position and magnify the
horizontal trace by a factor of 10 (X10). Keep in mind that the controls may be labeled differently from one model
to another, depending on the manufacturer. Refer to figure 6-16 as you study the control descriptions in the next
paragraphs.
6-13
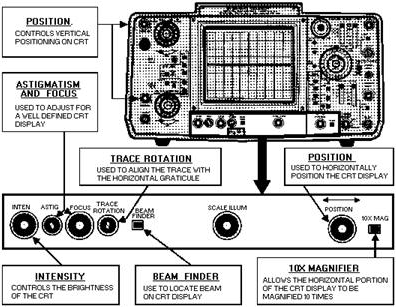
Figure 6-16. - Quality adjustment for CRT display. INTEN (Intensity) Control The INTEN (intensity) control (sometimes called BRIGHTNESS)
adjusts the brightness of the beam on the CRT. The control is rotated in a clockwise direction to increase the
intensity of the beam and should be adjusted to a minimum brightness level that is comfortable for viewing.
FOCUS and ASTIG (Astigmatism) Controls The FOCUS control adjusts the beam size. The ASTIG
(astigmatism) control adjusts the beam shape. The FOCUS and ASTIG controls are adjusted together to produce a
small, clearly defined circular dot. When displaying a line trace, you will use these same controls to produce a
well-defined line. Figure 6-17, view A, shows an out-of-focus beam dot. View B shows the beam in focus. Views C
and D show out-of-focus and in-focus traces, respectively.
6-14
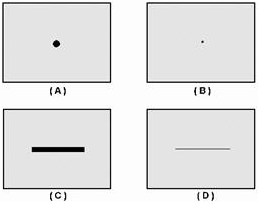
Figure 6-17. - Effects of FOCUS and ASTIG (astigmatism) controls. TRACE ROTATION Control The TRACE ROTATION control (figure 6-16) allows
for minor adjustments of the horizontal portion of the trace so that you can align it with the horizontal lines on
the graticule. BEAM FINDER Control Occasionally, the trace will actually be
located off the CRT (up or down or to the left or right) because of the orientation of the deflection plates. When
pushed, the BEAM FINDER (figure 6-16) pulls the beam onto the screen so that you can use the horizontal and
vertical POSITION controls to center the spot. Horizontal and Vertical POSITION Controls
The horizontal and vertical POSITION controls (figure 6-16) are used to position the trace. Because the graticule
is often drawn to represent a graph, some oscilloscopes have the positioning controls labeled to correspond to the
X and Y axes of the graph. The X axis represents horizontal movement; the Y axis represents the vertical movement.
Figure 6-18 shows the effects of positioning controls on the trace.
6-15
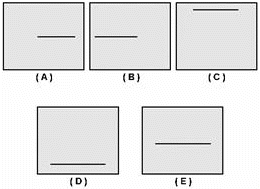
Figure 6-18. - Effects of horizontal and vertical controls. In view A, the horizontal control has been adjusted to move the trace too far to the right; in view B,
the trace has been moved too far to the left. In view C, the vertical POSITION control (discussed later) has been
adjusted to move the trace too close to the top; in view D, the trace has been moved too close to the bottom. View
E (figure 6-18) shows the trace properly positioned. 10X MAG (Magnifier) Switch
The 10X MAG (magnifier) switch (figure 6-16) allows you to magnify the displayed signal by a factor of 10 in the
horizontal direction. This ability is important when you need to expand the signal to evaluate it carefully.
COMPONENTS useD to DETERMINE The Amplitude of a Signal We will now discuss the dual-trace
components of the scope. You will use these components to determine the amplitude of a signal. Notice in figure
6-19 that the highlighted section at the upper left of the scope looks just the same as the section at the lower
left of the scope. This reveals the dual-trace capability section of the scope. The upper left section is the CH
(channel) 1 input and is the same as the CH 2 input at the lower left. An input to both inputs at the same time
will produce two independent traces on the CRT and use the dual-trace capability of the scope.
6-16
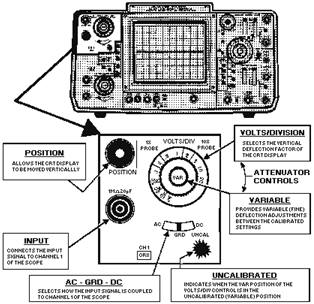
Figure 6-19. - Components that determine amplitude. For purposes of this introductory discussion, we will present only CH (channel) 1. You should realize
that the information presented also applies to CH 2. Vertical POSITION Control
The vertical POSITION control allows you to move the beam position up or down, as discussed earlier.
Input Connector The vertical input (or signal input) jack connects the signal to be
examined to the vertical-deflection amplifier. Some oscilloscopes may have two input jacks, one labeled AC and the
other labeled DC. Other models may have a single input jack with an associated switch, such as the AC GRD DC
switch in figure 6-19. This switch is used to select the ac or dc connection. In the DC position, the signal is
connected directly to the vertical-deflection amplifier; in the AC position, the signal is first fed through a
capacitor. Figure 6-20 shows the schematic of one arrangement.
6-17

Figure 6-20. - Vertical input arrangement. The VERTICAL-DEFLECTION Amplifier increases the amplitude of the input signal level required for the
deflection of the CRT beam. The deflection amplifier must not have any other effect on the signal, such as
changing the shape (called Distortion). Figure 6-21 shows the results of distortion occurring in a deflection
amplifier.

Figure 6-21. - Deflection amplifier distortion. Attenuator Control An amplifier can handle only a limited range of input
amplitudes before it begins to distort the signal. Signal distortion is prevented in oscilloscopes by the
incorporation of circuitry that permits adjustment of the input signal amplitude to a level that prevents
distortion from occurring. This adjustment is called the ATTENUATOR control in some scopes (VOLTS/DIV and VAR in
figure 6-19). This control extends the usefulness of the oscilloscope by enabling it to handle a wide range of
signal amplitudes. The attenuator usually consists of two controls. One is a multiposition (VOLTS/DIV)
control, and the other is a variable (VAR) potentiometer. Each position of the control may be marked either as to
the amount of voltage required to deflect the beam a unit distance, such as VOLTS/DIV, or as to the amount of
attenuation (called the DEFLECTION FACTOR) given to the signal, such as 100, 10, or 1. Suppose the .5
VOLTS/DIV position were selected. In this position, the beam would deflect vertically 1 division for every 0.5
volts of applied signal. If a sine wave occupied 4 divisions peak-to- peak, its amplitude would be 2 volts
peak-to-peak (4 ´ 0.5), as shown in figure 6-22.
6-18
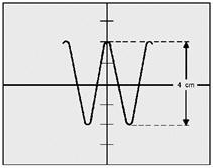
Figure 6-22. - Sine wave attenuation. The vertical attenuator control (VOLTS/DIV in figure 6-19) provides a means of adjusting the input
signal level to the amplifiers by steps. These steps are sequenced from low to high deflection factors. The
potentiometer control (VAR in figure 6-19) provides a means of fine, or variable, control between steps. This
control may be mounted separately, or it may be mounted on the attenuator control. When the control is mounted
separately, it is often marked as FINE Gain or simply Gain. When mounted on the attenuator control, it is usually
marked VARIABLE or VAR.
The variable control adds attenuation to the step that is selected. Since accurately calibrating a potentiometer
is difficult, the variable control is either left unmarked or the front panel is marked off in some convenient
units, such as 1-10 and 1-100. The attenuator control, however, can be accurately calibrated. To do this, you turn
off the variable control to remove it from the attenuator circuit. This position is usually marked CAL (calibrate)
on the panel, or an associated light indicates if the VAR control is on or off. In figure 6-19, the light called
UNCAL indicates the VAR control is in the uncalibrated position. COMPONENTS useD to SELECT The
VERTICAL OPERATING Mode As we discussed earlier, channel 1 is being used to discuss basic
operating procedures for the oscilloscope. Figure 6-23 shows how the vertical mode of operation is selected. The
VERT Mode section contains push-button switches that enable you to select channel 1, channel 2, and several other
vertical modes of operation. For the present discussion, note only that CH 1 is selected by these switches.
6-19
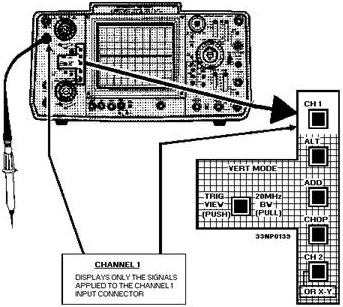
Figure 6-23. - Vertical-deflection controls. COMPONENTS useD to DETERMINE PERIOD TIME of The DIsPLAY The TIME/DIV (figure
6-24) controls on the scope determine the period time of the displayed waveform. As we discussed earlier, the
sweep generator develops the sawtooth waveform that is applied to the horizontal-deflection plates of the CRT.
This sawtooth voltage causes the beam to move across the screen. This trace (sometimes called SWEEP) sets the
frequency of the TIME Base of the oscilloscope. The frequency of the time base is variable, which enables the
oscilloscope to accept a wide range of input frequencies. Again, two controls are used (figure 6-24). One is a
multiposition switch (TIME/DIV) that changes the frequency of the sweep generator in steps. The second control is
a potentiometer (VAR) that varies the frequency between steps. Each step on the TIME/DIV control is calibrated.
The front panel has markings that group the numbers into microseconds and milliseconds.
6-20
| - |
Matter, Energy,
and Direct Current |
| - |
Alternating Current and Transformers |
| - |
Circuit Protection, Control, and Measurement |
| - |
Electrical Conductors, Wiring Techniques,
and Schematic Reading |
| - |
Generators and Motors |
| - |
Electronic Emission, Tubes, and Power Supplies |
| - |
Solid-State Devices and Power Supplies |
| - |
Amplifiers |
| - |
Wave-Generation and Wave-Shaping Circuits |
| - |
Wave Propagation, Transmission Lines, and
Antennas |
| - |
Microwave Principles |
| - |
Modulation Principles |
| - |
Introduction to Number Systems and Logic Circuits |
| - |
- Introduction to Microelectronics |
| - |
Principles of Synchros, Servos, and Gyros |
| - |
Introduction to Test Equipment |
| - |
Radio-Frequency Communications Principles |
| - |
Radar Principles |
| - |
The Technician's Handbook, Master Glossary |
| - |
Test Methods and Practices |
| - |
Introduction to Digital Computers |
| - |
Magnetic Recording |
| - |
Introduction to Fiber Optics |
| Note: Navy Electricity and Electronics Training
Series (NEETS) content is U.S. Navy property in the public domain. |
|


