Module 16 - Introduction to Test Equipment
Pages i,
1-1,
1-11,
1-21,
2-1,
2-11,
2-21,
3-1,
3-11,
3-21,
3-31,
4-1,
4-11,
4-21,
5-1,
5-11,
5-21,
5-31,
6-1,
6-11,
6-21,
6-31,
6-41, Index

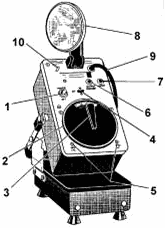
Figure 2-7. - Electronic strobotac.
Table 2-1. - Strobotac Controls and Indicators

2-11
The normal speed range is from 110 to 25,000 rpm. At speeds below 600 rpm, "flicker"
becomes a problem because the human eye cannot retain successive images long enough
to create the illusion of continuous motion. The life of the strobotron lamp is
approximately 250 hours if used at flashing speeds of less than 5,000 rpm, or 100
hours if used at higher speeds. ELECTRICAL Output Frequency
All alternating voltage sources are generated at a set frequency or range of frequencies.
A Frequency METER provides a means of measuring this frequency. The electrical output
frequency of ac power generators can be measured by a vibrating reed, a tuned circuit,
or by a crossed-coil, iron-vane type meter. The vibrating-reed device is the simplest
type of frequency meter. It has the advantage of being rugged enough to be mounted
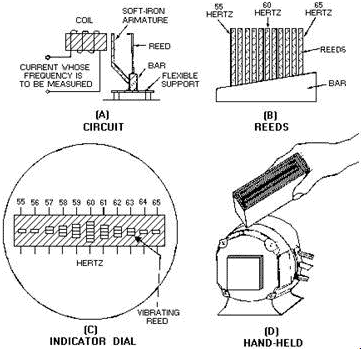
on generator control panels. A simplified diagram of a vibrating-reed
frequency meter is shown in figure 2-8, views a through D. In view A, you can see
that the current to be measured flows through the coil and exerts maximum attraction
on the soft-iron armature twice during each cycle. The armature is attached to the
bar, which is mounted on a flexible support. Reeds of suitable dimensions to have
natural vibration frequencies of 110, 112, 114, and so forth, up to 130 hertz are
mounted on the bar (view B). The reed with a frequency of 110 hertz is marked 55
hertz; the one with a frequency of 112 hertz is marked 56 hertz; the one with a
frequency of 120 hertz is marked 60 hertz, and so forth.

Figure 2-8. - Vibrating-reed frequency meter.
2-12
When the coil is energized by a current with a frequency between 55 and 65 hertz,
all the reeds are vibrated slightly; but, the reed having a natural frequency closest
to that of the energizing current vibrates through a larger amplitude. The frequency
is read from the scale value opposite the reed having the greatest amplitude of
vibration. In some instruments, the reeds are the same length; but
they are weighted by different amounts at the top so they will have different natural
rates of vibration. An end view of the reeds in the indicator is shown in view C.
If the energizing current has a frequency of 60 hertz, the reed marked 60 will vibrate
the greatest amount, as shown. View D shows a hand-held vibrating-reed frequency
meter mounted on the casing of a motor-generator.
Tuned Circuits Tuned Circuits are used as filters
for the passage or rejection of specific frequencies. Bandpass FILTERS and Band-REJECT
FILTERS are examples of this type. Tuned circuits have certain characteristics that
make them ideal for certain types of filters, especially where a high degree of
selectivity is desired. a series-tuned circuit offers a low impedance to currents
of the particular frequency to which the circuit is tuned and a relatively high
impedance to currents of all other frequencies. a parallel-tuned circuit, on the
other hand, offers a very high impedance to currents of its natural, or resonant,
frequency and a relatively low impedance to others. If you feel you need to review
the subject of tuned circuits at this time, refer to NEETS, Module 9, Introduction
to Wave-Generation and Wave- Shaping Circuits, for more information on these circuits
and their applications. Audio FREQUENCIES
Frequency measurements in the AF range can be made by the comparison method or the
direct- reading frequency meter. Frequency comparisons can be made by the use of
a calibrated af generator in conjunction with either an oscilloscope or a modulator
and a zero-beat indicating device. Direct-reading frequency measurements can be
made by instruments using series, frequency-selective electrical networks, bridge
test sets having null indicators, or counting-type frequency meters.
Heterodyne Frequency Meters Heterodyne frequency meters
are available in several varieties. They measure the frequency of the unknown signal
by matching the unknown signal with a locally generated signal of the same frequency
obtained from a calibrated, precision oscillator. This method is normally referred
to as zero beating. When a perfect frequency match is obtained, it is indicated
by the absence of a beat note (zero beat). The technician generally uses a set of
headphones to detect a zero-beat condition in the equipment being tested.
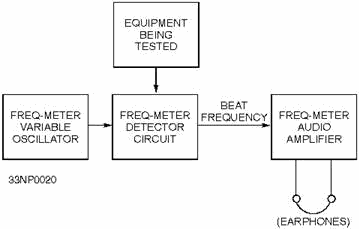
The basic heterodyne meter (figure 2-9) is a calibrated variable oscillator, which
heterodynes against the frequency to be measured. Coupling is accomplished between
the frequency meter and the output of the equipment under test. (Note: This coupling
should be in accordance with the step-by-step procedures listed in the technical
manual for the frequency meter.) The calibrated oscillator is then tuned so that
the difference between the oscillator frequency and the unknown frequency is in
the af range. This difference in frequency is known as the BEAT Frequency. As the
two frequencies are brought closer to the same value, the tone in the headset will
decrease in pitch until it is replaced by a series of rapid clicks. As the process
is continued, the clicks will decrease in rapidity until they stop altogether. This
is the point of zero beat; that is, the point at which the frequency generated in
the oscillator of the frequency meter is equal to the frequency of the unknown signal
being measured.
2-13

Figure 2-9. - Basic heterodyne meter (block diagram).
Q-7. In a heterodyne-type frequency meter, what is the
difference between the oscillator frequency and the unknown frequency?
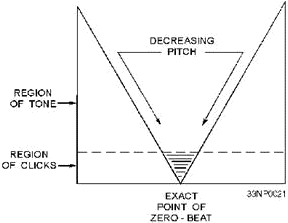
For all practical purposes, the point of zero beat can be assumed when the clicks
are heard at infrequent intervals. Figure 2-10 illustrates the zero-beat concept.
Maintaining a condition of absolute silence in the earphones is extremely difficult
when you are making this measurement. When the incoming signal is strong, the clicks
are sharp and distinct. When the signal is weak, the zero-beat condition is evidenced
by a slowly changing "swishing" or "rushing" sound in the headset. After the zero
beat is obtained, the dial reading corresponds to the frequency measured.

Figure 2-10. - Graph of sound heard in earphone when zero beating.
2-14
The manufacturer's calibration book is a very important part of the frequency
meter package; in fact, the book is so important that it bears the same serial number
as the heterodyne-type frequency meter itself. Contained in this book is a list
of the dial settings and the corresponding frequencies produced by that meter at
those dial settings. Operating instructions for the meter are also included.
Absorption Wavemeter WAVEMETERS are calibrated resonant
circuits used to measure frequency. The accuracy of wavemeters is not as high as
that of heterodyne-type frequency meters; however, they have the advantage of being
comparatively simple and can be easily carried. Q-8. What
equipment uses a calibrated resonant circuit to measure frequency?
Any type of resonant circuit can be used in wavemeter applications. The exact kind
of circuit used depends on the frequency range for which the meter is intended.
Resonant circuits consisting of coils and capacitors are used for VLF through VHF
wavemeters. The simplified illustration of an absorption wavemeter,
shown in figure 2-11, consists of a pickup coil, a fixed capacitor, a lamp, a variable
capacitor, and a calibrated dial. When the wavemeter's components are at resonance,
maximum current flows in the loop, illuminating the lamp to maximum brilliance.
The calibrated dial setting is converted to a frequency by means of a chart, or
graph, in the instruction manual. If the lamp glows very brightly, the wavemeter
should be coupled more loosely to the circuit. For greatest accuracy, the wavemeter
should be coupled so that its indicator lamp provides only a faint glow when tuned
to the resonant frequency.

Figure 2-11. - Absorption wavemeter circuit.
FREQUENCIES ABOVE The Audio RANGE The
signal frequencies of radio and radar equipments that operate in the UHF and SHF
ranges can be measured by resonant, cavity-type wavemeters or resonant, coaxial-line-type
wavemeters. When properly calibrated, resonant-cavity and resonant-coaxial line
wavemeters are more accurate and have better stability than wavemeters used for
measurements in the LF to VHF ranges. These frequency-measuring instruments are
often furnished as part of the equipment. They are also available as general-purpose
test sets.
2-15
Although many wavemeters are used in performing various functions, the cavity-type
wavemeter is the type most commonly used. Only this type is discussed in some detail.
Cavity Wavemeter Figure 2-12 shows a typical CAVITY
WAVEMETER. The wavemeter is of the type commonly used for the measurement of microwave
frequencies. The device uses a resonant cavity. The resonant frequency of the cavity
is varied by means of a plunger, which is mechanically connected to a micrometer
mechanism. Movement of the plunger into the cavity reduces the cavity size and increases
the resonant frequency. Conversely, an increase in the size of the cavity (made
by withdrawing the plunger) lowers the resonant frequency. The microwave energy
from the equipment being tested is fed into the wavemeter through one of two inputs,
A or B. The crystal rectifier then detects (rectifies) the signal. The rectified
current is indicated on current meter M.

Figure 2-12. - Typical cavity wavemeter.
Electronic Frequency Counters Another
device used to measure frequencies above the audio range is the ELECTRONIC Frequency
COUNTER. Since this instrument will be covered in detail in a later chapter, only
a brief description is provided at this time. The electronic frequency
counter is a high-speed electronic counter with an accurate, crystal- controlled
time base. This combination provides a frequency counter that automatically counts
and displays the number of events occurring in a precise time interval. The frequency
counter itself does not generate any signal; it merely counts the recurring pulses
fed to it.
2-16
WAVEforM ANALYSIs
WAVEforM ANALYSIs can be made by observing displays of voltage and
current variations with respect to time or by harmonic analysis of complex signals.
Waveform displays are particularly valuable for adjusting and testing pulse-generating,
pulse-forming, and pulse-amplifying circuits. The waveform visual display is also useful for determining signal distortion, phase shift, modulation factor, frequency,
and peak-to-peak voltage. Waveform analysis is used in various electrical
and electronic equipment troubleshooting. This section will briefly discuss the
oscilloscope and spectrum analyzer to provide you with basic knowledge of this test
equipment. Q-9. Name two instruments used to analyze waveforms.
USE of The OSCILLOSCOPE The CATHODE-RAY OSCILLOSCOPE
(CRO or O-SCOPE) is commonly used for the analysis of waveforms generated by electronic
equipment. Several types of cathode-ray oscilloscopes are available for making waveform
analysis. The oscilloscope required for a particular test is determined by characteristics
such as input-frequency response, input impedance, sensitivity, sweep rate, and
the methods of sweep control. The SYNCHROSCOPE is an adaptation of the cathode-ray
oscilloscope. It features a wide-band amplifier, triggered sweep, and retrace blanking
circuits. These circuits are desirable for the analysis of pulse waveforms.
Oscilloscopes are also part of some harmonic analysis test equipments that display
harmonic energy levels. To effectively analyze waveform displays, you must know
the correct wave shape. The maintenance instructions manual for each piece of equipment
illustrates what waveforms you should observe at the various test points throughout
the equipment. Waveforms that will be observed at any one selected test point will
differ; each waveform will depend on whether the operation of the equipment is normal
or abnormal. The display observed on a cathode-ray oscilloscope is
ordinarily one similar to those shown in figure 2-13. Views a and B show the instantaneous
voltage of the wave plotted against time. Elapsed time (view A) is indicated by
horizontal distance, from left to right, across the etched grid (graticule) placed
over the face of the tube. The amplitude (view B) of the wave is measured vertically
on the graph.
2-17

Figure 2-13. - Typical waveform displays.
The oscilloscope is also used to picture changes in quantities other
than simply the voltages in electric circuits. For example, if you need to see the
changes in waveform of an electric current, you must first send the current through
a small resistor. You can then use the oscilloscope to view the voltage wave across
the resistor. Other quantities, such as temperatures, pressures, speeds, and accelerations,
can be translated into voltages by means of suitable transducers and then viewed
on the oscilloscope. a detailed discussion of the oscilloscope is presented in chapter
6 of this module. USE of The SPECTRUM ANALYZER
The SPECTRUM ANALYZER is a device that sweeps over a band of frequencies to determine
(1) what frequencies are being produced by a specific circuit under test and (2)
the amplitude of each frequency component. To accomplish this, the spectrum analyzer
first presents a pattern on a display. Then the relative amplitudes of the various
frequencies of the spectrum of the pattern are plotted (see figure 2-14). On the
vertical, or Y axis, the amplitudes are plotted; on the horizontal, or X axis, the
frequencies (time base) are plotted. The overall pattern of this display indicates
the proportion of power present at the various frequencies within the SPECTRUM (fundamental
frequency with sideband frequencies).
2-18

Figure 2-14. - Spectrum analyzer pattern.
Q-10. What device sweeps a band of frequencies to determine
frequencies and amplitudes of each frequency component? The spectrum
analyzer is used to examine the frequency spectrum of radar transmissions, local
oscillators, test sets, and other equipment operating within its frequency range.
Proper interpretation of the displayed frequency spectrum enables you to determine
the degree of efficiency of the equipment under test. With experience, you will
be able to determine definite areas of malfunctioning components within equipment.
In any event, successful spectrum analysis depends on the proper operation of a
spectrum analyzer and your ability to correctly interpret the displayed frequencies.
Later, in chapter 6, we will discuss the various controls, indicators, and connectors
contained on the spectrum analyzer.
TESTING SEMICONDUCTOR DEVICES
Because of the reliability of semiconductor devices, servicing techniques
developed for transistorized equipment differ from those normally used for electron-tube
circuits. Electron tubes are usually considered to be the circuit component most
susceptible to failure and are normally the first components to be tested. Transistors,
however, are capable of operating in excess of 30,000 hours at maximum rating without
failure. They are often soldered in the circuit in much the same manner as resistors
and capacitors. Therefore, they are NOT so quickly removed for testing as tubes.
Substitution of a semiconductor diode or transistor known to be in good condition
is one method of determining the quality of a questionable semiconductor device.
This method should be used only after you have made voltage and resistance measurements.
This ensures the circuit has no defect that might
2-19
damage the substitute semiconductor device. If more than one defective semiconductor
is present in the equipment section where trouble has been localized, the semiconductor
replacement method becomes cumbersome. Several semiconductors may have to be replaced
before the trouble is corrected. To determine which stage(s) failed and which semiconductors
are not defective, you must test all the removed semiconductors. You can do this
by observing whether the equipment operates correctly as you reinsert each of the
removed semiconductor devices into the equipment. TESTING DIODES
Semiconductor diodes, such as general-purpose germanium and silicon diodes, power
silicon diodes, and microwave silicon diodes, can be tested effectively under actual
operating conditions. However, crystal-rectifier testers are available to determine
dc characteristics that provide an indication of crystal- diode quality.
A common type of crystal-diode test set is a combination ohmmeter-ammeter. Measurements
of forward resistance, back resistance, and reverse current can be made with this
equipment. Using the results of these measurements, you can determine the relative
condition of these components by comparing their measured values with typical values
obtained from test information furnished with the test set or from the manufacturer's
data sheets. a check that provides a rough indication of the rectifying property
of a diode is the comparison of the back-and-forward resistance of the diode at
a specified voltage. a typical back-to-forward-resistance ratio is on the order
of 10 to 1, and a forward-resistance value of 50 to 80 ohms is common.
Q-11. What is the typical back-to-forward resistance ratio of a good-quality
diode? Testing Diodes with an Ohmmeter
A convenient test for a semiconductor diode requires only an ohmmeter. The back-and-forward
resistance can be measured at a voltage determined by the battery potential of the
ohmmeter and the resistance range at which the meter is set. When the test leads
of the ohmmeter are connected to the diode, a resistance will be measured that is
different from the resistance indicated if the leads are reversed. The smaller value
is called the forWARD Resistance, and the larger value is called the BACK Resistance.
If the ratio of back-to-forward resistance is greater than 10 to 1, the diode should
be capable of functioning as a rectifier. However, keep in mind that this is a very
limited test that does not take into account the action of the diode at voltages
of different magnitudes and frequencies. (Note: This test should never be used to
test crystal mixer diodes in radars. It will destroy their sensitivity.)
Testing Diodes with Oscilloscopes An oscilloscope
can be used to graphically display the back-and-forward resistance characteristics
of a crystal diode. a circuit used in conjunction with an oscilloscope to make this
test is shown in figure 2- 15. This circuit uses the oscilloscope line-test voltage
as the test signal. a series circuit (composed of resistor R1 and the internal resistance
in the line-test circuit) decreases a 3-volt, open-circuit test voltage to a value
of approximately 2 volts peak to peak.
2-20
| - |
Matter, Energy,
and Direct Current |
| - |
Alternating Current and Transformers |
| - |
Circuit Protection, Control, and Measurement |
| - |
Electrical Conductors, Wiring Techniques,
and Schematic Reading |
| - |
Generators and Motors |
| - |
Electronic Emission, Tubes, and Power Supplies |
| - |
Solid-State Devices and Power Supplies |
| - |
Amplifiers |
| - |
Wave-Generation and Wave-Shaping Circuits |
| - |
Wave Propagation, Transmission Lines, and
Antennas |
| - |
Microwave Principles |
| - |
Modulation Principles |
| - |
Introduction to Number Systems and Logic Circuits |
| - |
- Introduction to Microelectronics |
| - |
Principles of Synchros, Servos, and Gyros |
| - |
Introduction to Test Equipment |
| - |
Radio-Frequency Communications Principles |
| - |
Radar Principles |
| - |
The Technician's Handbook, Master Glossary |
| - |
Test Methods and Practices |
| - |
Introduction to Digital Computers |
| - |
Magnetic Recording |
| - |
Introduction to Fiber Optics |
| Note: Navy Electricity and Electronics Training
Series (NEETS) content is U.S. Navy property in the public domain. |
|


