Module 16 - Introduction to Test Equipment
Pages i,
1-1,
1-11,
1-21,
2-1,
2-11,
2-21,
3-1,
3-11,
3-21,
3-31,
4-1,
4-11,
4-21,
5-1,
5-11,
5-21,
5-31,
6-1,
6-11,
6-21,
6-31,
6-41, Index
Oscillator
The oscillator produces a constant amplitude, low distortion sine wave test signal. The frequency of the test
signal is programmable between one variable frequency (50/60 Hz), and two fixed frequencies (400 Hz and 2000 Hz).
The variable frequency depends on the input power line used for the Tracker 2000; a 50-Hz line produces a 50-Hz
test signal, and a 60-Hz line produces a 60-Hz test signal. If a 400- Hz power line is used, an 80-Hz test signal
is provided. This versatility is built in to ensure you will always have low, medium, and high frequencies to work
with.
Signal Section The signal section is considered to be the heart of the Tracker 2000. In
this section, the signal from the oscillator is applied across two terminals of a device being tested via the
front-panel jacks. The test signal causes a current to flow through the device and a voltage drop to
occur across its terminals. The current flow causes a vertical deflection of the trace on the CRT display, while
the voltage drop across the device causes a horizontal deflection of the trace on the CRT display. By combining
these, the current-voltage signature of the device being tested is displayed on the CRT. The test signal
appears at the front-panel test jacks as though it is being originated by a voltage source (Vs) with a
series output impedance (Zs). An equivalent circuit of the signal section is shown in figure 5-27. As you can see,
the figure also shows how the terminal voltage affects the horizontal deflection plates of the CRT, and how the
current through the terminals affects the vertical deflection plates through current sensing point I.
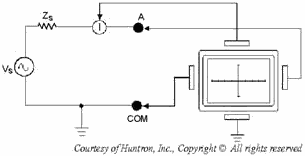
Figure 5-27. - Signal section equivalent circuit. An open circuit has zero current flowing through the terminals and maximum voltage drop across the
terminals. In all ranges, this is represented by a straight horizontal trace from left to right on the CRT
display, as seen in figure 5-28 view A. When a short occurs, maximum current flows through the terminals, and the
voltage drop is considered to be zero. This occurs in all ranges and is represented by a straight vertical trace
from top to bottom of the CRT display, as seen in figure 5-28 view B.
5-31
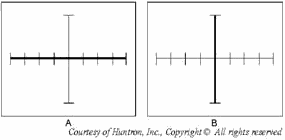
Figure 5-28. - Open and short circuit display. Pulse Generator The pulse generator provides dynamic testing for certain types
of devices by driving the control input of the device under test. The normal two-terminal mode of testing can be
considered a static test, since devices with three or more terminals are not tested in their active mode. However,
with the pulse generator, an in-circuit active test is possible. In the PULSE mode, this circuit uses the
zero crossing of the test signal to trigger the start of the pulse. When positive (+) is enabled, a positive-going
zero crossing triggers a positive pulse. When negative (-) is enabled, a negative-going zero crossing triggers a
negative pulse. If both are enabled, then both positive and negative pulses are produced on alternate crossings
(composite pulses). Once a pulse is triggered, its duration is set by the WIDTH control knob. Figure 5-29 shows
the waveforms for three pulse polarity types at various settings of the WIDTH control.
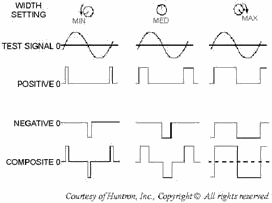
Figure 5-29. - Pulse generator waveforms. The LEVEL control adjusts the peak of each pulse from zero to 5 volts with the polarity dependent on the
pulse polarity selected. When an open circuit is present, a maximum output of 5 volts peak-to-peak
5-32
is present with either positive or negative selected, and 10 volts peak-to-peak when the composite
pulse is active. Q-10. What minimum/maximum voltage level can be attained in the pulse generator
section by adjusting the LEVEL control? In the DC mode, a zero-to-5-volts DC level is produced at G1 and
G2 on the front panel. The polarity of the level is controlled by the positive and negative buttons. By pressing
the positive button, you enable a positive DC output and disable the negative button. By pressing the negative
button, you enable a negative DC voltage only if the positive button is in the off position. The WIDTH control
knob has no effect in the DC mode of operation. CRT Display The CRT deflection drivers boost the low-level outputs from the signal
section to the higher voltage levels needed by the deflection plates in the CRT. The HORIZ (horizontal) and VERT
(vertical) controls on the front panel adjust the position of the CRT trace. The TRACE ROTATE control on the front
panel is used to adjust the short circuit vertical trace to be parallel with the vertical axis on the CRT
graticule.
Three other controls (INTENSITY, FOCUS, and astigmatism) are used to adjust the proper brightness and clarity of
the trace. The front-panel INTENSITY control is the primary way to adjust the visual quality of the trace. FOCUS
is located on the back panel and is used as your trimming adjustment. Astigmatism is an internal adjustment and is
set at the factory. Power Supply The power supply is an ac-line-operated power
supply that is turned on and off by the Power/INTENSITY knob located on the front panel. Once power is turned on,
the power supply provides 12 V dc (nominal) and ±5 V dc (regulated) for normal circuit operational use in the
oscillator, pulse generator, signal, and control logic sections of the Tracker 2000. The other outputs
from the power supply are provided to the CRT display section. The CRT is provided with a filament voltage of 6.3
Vrms, +180 V dc for the deflection driver circuits, and a regulated -1320 V dc for the CRT
acceleration voltage.
COMPONENT TESTING Now that you have a basic understanding of how the Tracker 2000 works,
we will show you a few examples of different components with values and their associated displays. Because of the
large number of different values that can be given to any component, this section will present only a few.
Testing Resistors A resistance across the test probes will cause the trace of the Tracker
2000 to rotate in a counterclockwise direction around its center axis from an open circuit position. The degree of
rotation is directly related to the resistance value. The higher the value, the less rotation will be observed.
Low RANGE. - The low range is designed to test for resistance values between 1Ω
and 1K. Figure 5-30 shows the effect of resistance on the angle of rotation in low range. a 1Ω
resistor causes almost 90º of rotation, and a 50Ω resistor produces a 45º rotation. a
400Ω resistor causes a very small rotation angle. Resistors lower than 1Ω
will appear as a short circuit (vertical trace), and resistance values above 400Ω
will look like an open circuit (horizontal trace).
5-33

Figure 5-30. - Effects of resistance on the rotation angle in low range. MEDIUM 1 RANGE. - The medium 1 range is designed to test for resistance values between 50Ω
and 10KW. Figure 5-31 shows the signatures for a 50Ω
resistor, a 1KΩ resistor, and a 10KΩ resistor using the
medium 1 range. Resistors that are smaller than 50W display a signature that is almost a vertical line. a 1KΩ
resistor causes a change in the angle of rotation of 45º, whereas the display of a 10KΩ
resistor shows only a slight rotation. Resistance values under test higher than 10KΩ
produce a signature with such a small rotation angle that it almost appears to be a horizontal line.

Figure 5-31. - Effects of resistance on the rotation angle in medium 1 range. Q-11. Medium 1 range is designed to check what resistance values?
MEDIUM 2 RANGE. - The medium 2 range is designed to test for resistance values between 1KW and 200KW Figure
5-32 shows the signatures for a 1KW resistor, a 15KW resistor, and a 200KW resistor in the medium 2 range.
Resistance values that are smaller than 1KW will appear to be almost a vertical line. a 15KW resistor causes a
change in the angle of rotation of 45º, whereas the display for a 200KW resistor shows only a slight rotation.
When resistance values being tested are higher than 200KW, the displayed signature that they produce will have
such a small rotation that it appears to be almost a horizontal line.
5-34

Figure 5-32. - Effects of resistance on the rotation angle in medium 2 range. High RANGE. - The high range is designed to test resistance values between 3KΩ
and 1MΩ. Figure 5-33 shows the signatures that would be displayed for a 3KΩ
resistor, a 50KΩ resistor, and a 1MΩ resistor using the
high range. Resistors that are smaller than 3KΩ will appear to be almost a vertical
line. a 50KΩ resistor will cause a change in the angle of rotation of 45º, whereas the
display for a 1MΩ resistor shows only a slight rotation that is very close to a
horizontal line. Resistance values higher than 1MΩ will produce such a small rotation
that it appears to be a horizontal line.

Figure 5-33. - Effects of resistance on the rotation angle in high range. Testing Capacitors When you test capacitors, the signature will be displayed as
an ellipse. The size and shape of the ellipse depend on the capacitor value, test signal frequency, and the
selected impedance range. Figure 5-34 shows the signature of a 0.22mF capacitor in each of the 12 combinations of
range and frequency. As you review this figure, you will notice that the signature appears to be an open circuit
in the low range at 60 Hz; while in the high range at 2000 Hz, the signature appears to be a short. Between these,
the signatures displayed are a variety of ellipsoids, which demonstrates that certain range and frequency
combinations are better than others for examining a capacitor.
5-35
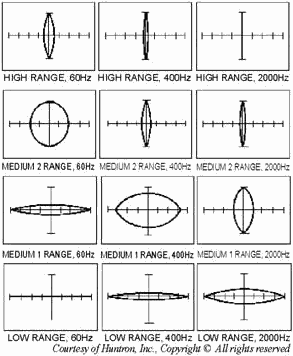
Figure 5-34. - Signature of a 0.22mF capacitor. Table 5-5 lists the range of capacitance covered by each of the 12 range and frequency combinations for
the Tracker 2000. The lowest value of capacitance in each combination will produce a signature of a very narrow
horizontal ellipsoid. Capacitors with less of a value than these will appear to be an open. The uppermost value of
capacitance in each combination will produce a very narrow vertical ellipsoid signature. Capacitors of greater
value than these will appear as a vertical line signature of a short circuit.
5-36
Table 5-5. - Min/Max Capacitance Values
 Testing Inductors Inductors, like capacitors, produce an elliptical signature
on the Tracker 2000. Figure 5-35 shows you the signatures produced in each of the 12 range and frequency
combinations by a 250mH inductor.
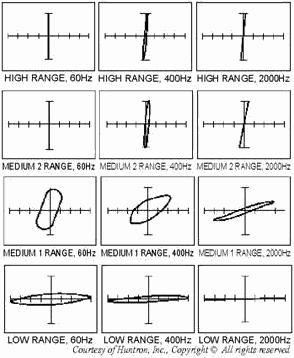
Figure 5-35. - Signatures of a 250mH inductor. Ferrite inductors can also be checked using this unit; however, the signature produced will be
different. Ferrite inductors operate well at high frequencies, but saturate at low frequencies. Figure 5-36 shows
the signature of a 490mH ferrite inductor tested at 60 Hz. In low and medium 1, you can see that
5-37
the signature shows distortion. However, in medium 2 and high ranges, the impedance of the inductor is
low compared with the internal impedance of the Tracker 2000, so the signatures are a split vertical trace.
Figures 5-37 and 5-38 show the same 490mH inductor being tested at 400 Hz and 2000 Hz.
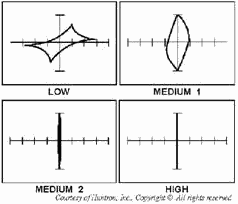
Figure 5-36. - Signatures of a 490mH ferrite inductor tested at 60 Hz.
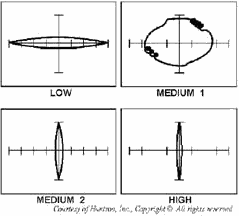
Figure 5-37. - Signature of a 490mH ferrite inductor at 400 Hz.
5-38

Figure 5-38. - Signature of a 490mH ferrite inductor at 2000 Hz.
Summary Now that we have completed this chapter, let's review the more important points. The type of meter used
to measure power is the Power METER. One type of wattmeter is the AN/URM-120. It is an
IN-LINE TYPE WATTMETER. The principal function of a Signal GENERATOR is to produce an
alternating voltage of the desired frequency and amplitude, which has the necessary modulation for the test or
measurement concerned. There are basically two types of signal generators: AF
and RF Frequency GENERATORS. The instrument used to determine the frequency of a signal is
the Frequency COUNTER. An instrument of great value to a technician in troubleshooting
digital integrated logic circuits is the LOGIC PROBE. The HUNTRON TRACKER 2000
is a versatile piece of test equipment that is used to compare known good devices against those of unknown quality
or troubleshoot to the component level after power is disconnected to the device under test.
5-39
Answers to Questions Q1. Through Q11. A-1. Load. A-2. An unbalance in the metering bridge.
A-3. Attenuator. A-4. Oscillator circuit, modulator, and output control circuit.
A-5. To produce an AF (or video) signal that can be superimposed on the RF signal produced by the
oscillator. A-6. 1 MHz and 10 MHz. A-7. DIM. A-8. Positive voltage (+V) and negative
current (-I). A-9. TRACE ROTATE control.
A-10. 0 to 5 volts. A-11. 50Ω to 10KΩ.
5-40
| - |
Matter, Energy,
and Direct Current |
| - |
Alternating Current and Transformers |
| - |
Circuit Protection, Control, and Measurement |
| - |
Electrical Conductors, Wiring Techniques,
and Schematic Reading |
| - |
Generators and Motors |
| - |
Electronic Emission, Tubes, and Power Supplies |
| - |
Solid-State Devices and Power Supplies |
| - |
Amplifiers |
| - |
Wave-Generation and Wave-Shaping Circuits |
| - |
Wave Propagation, Transmission Lines, and
Antennas |
| - |
Microwave Principles |
| - |
Modulation Principles |
| - |
Introduction to Number Systems and Logic Circuits |
| - |
- Introduction to Microelectronics |
| - |
Principles of Synchros, Servos, and Gyros |
| - |
Introduction to Test Equipment |
| - |
Radio-Frequency Communications Principles |
| - |
Radar Principles |
| - |
The Technician's Handbook, Master Glossary |
| - |
Test Methods and Practices |
| - |
Introduction to Digital Computers |
| - |
Magnetic Recording |
| - |
Introduction to Fiber Optics |
| Note: Navy Electricity and Electronics Training
Series (NEETS) content is U.S. Navy property in the public domain. |
|


