|
|||||||||||||
 |
|||||||||||||
QuickSmith Online Interactive Smith Chart SnP Data Plotter |
|||||||||||||
|
Featured Product Archive The inventions and products featured on these pages were chosen either for their uniqueness in the RF engineering realm, or are simply awesome (or ridiculous) enough to warrant an appearance. | 1 | 2 | 3 | 4 | 5 | 6 | 7 | 8 | 9 | 10 | 11 | 12 | 13 | 14 | 15 | 16 | 17 | 18 | 19 | 20 | 21 |
Note: This version of QuickSmith is no longer available; the website disappeared. Instead, click here for a very nice Web-based version of QuickSmith, by Nathan Iyer. There's a new online interactive Smith chart s-parameter plotter in town, and it goes by the name of QuickSmith. Justin Coulston, designer of QuickSmith, sent me an e-mail asking that I take a look at it. I did, and I like what he has done. Assuming that anybody reading this is already at least somewhat familiar with the Smith chart, this report will concentrate on the features of QuickSmith. Keep in mind while checking out QuickSmith for yourself that it is still in Beta phase, so your feedback to Justin will be appreciated.
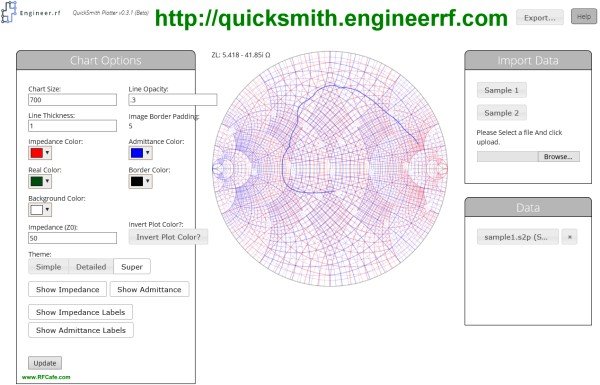
QuickSmith Online Interactive Smith Chart Plotter screen shot.
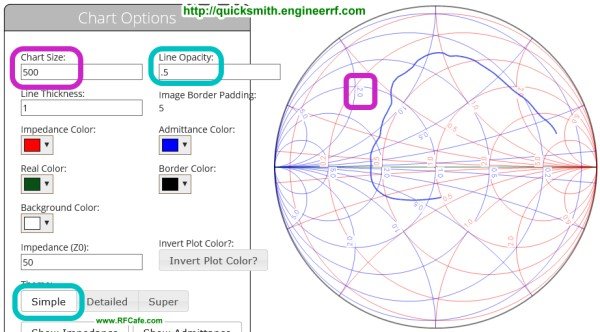
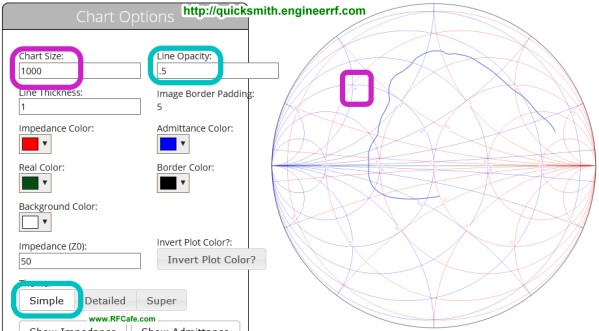
In the upper right corner of the screen are 'Export' and 'Help' buttons. At this time 'Help' does not appear to be implemented; however, you can go to https://www.engineerrf.com/getting-started (the 'www.' part of the URL is required as of this writing) for a brief introduction. Clicking the 'Export' button opens a window to allow printing the Smith chart display to either a PNG or PDF file. A QuickSmith Forum has been started for user interaction (a good place to provide feedback). Three levels of detail are available for the Smith chart background format: Simple, Detailed, and Super, along with an option to display admittance circles. A couple notes are in order about setting the display parameters. There is a 'Chart Size' parameter that can be set between 50 and 1000. I did not check QuickSmith on a cellphone so maybe smaller values like 50 are needed there, but on a desktop, it is too small. A setting of 1000 (or anything >500) produces a display that is the same size on the screen as the 500 size setting, but the circle labels and line thicknesses are smaller (see the two screen shots below). I don't know if that is the planned use of sizes above 500, but it is useful for controlling line thickness.
One way to get a larger Smith chart display and increase cursor position accuracy is to use the browser's magnification feature (see screen shot below). Cursor resolution remains the same, but it is easier to see where it lies in the Smith chart. The cursor position's complex impedance is displayed dynamically as it moves. I could not find a way to display admittance values, even with turning off the impedance circles.
That covers the basic features of QuickSmith. It promises to be a very useful tool both in its present form and once planned improvements are implemented. Thanks to Justin for investing time to make it available.
Posted January 4, 2016 |
|||||||||||||
 |
|||||||||||||
|
|||||||||||||
 An overall screen shot is provided below. QuickSmith
takes as an input standard format
An overall screen shot is provided below. QuickSmith
takes as an input standard format


|
||||||||||||||||||||||||||||||||||||