|
|
| Search: |
Please support my efforts by
|
|
|
Serving a Pleasing Blend of Yesterday, Today, and Tomorrow™ |
|
|
|
|
|
|
| :
| RF
for Office | RF
& for Visio |
|
|
 |
Box and Whisker Plot |
|
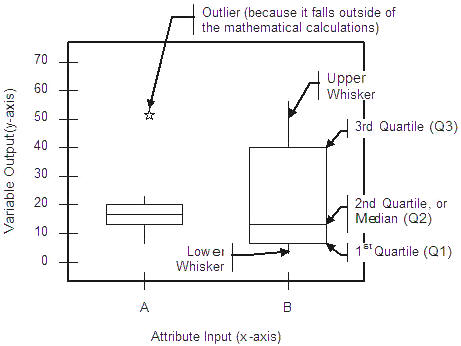
The Box & Whisker plot is
used to display variability and centering of processes, based on quartiles, in a variable output (y-axis) versus
an attribute (x-axis) at one or more levels. See the example plot below.
- Quartiles serve to rank-order the data and identify the 25th, 50th, and
75th percentiles.
- The Interquartile (IQ) Range is equal to the range between the first and
3rd quartiles (Q3-Q1).
- Whiskers are limited by a mathematical calculation.
The upper whisker can be no longer than: Q3 + 1.5 (Q3-Q1). The whisker line is drawn to the
largest value in the data set below this calculated value. If there are data points above this value, they show up
as asterisks to indicate they may be outliers. The same is true for the lower whisker with a limit of Q1 - 1.5x
(Q3 - Q1). The whisker line is then drawn to the smallest value in the data set above this calculated value.
|
 |
|
|