|
|||||||||||||
 |
|||||||||||||
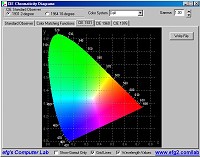
C.I.E. Chromaticity Diagram |
|||||||||||||
|
Earl F. Glynn Chromaticity Diagram Software Chromaticity is commonly defined as the quality of color characterized by its dominant or complementary wavelength and purity taken together. This chromaticity chart plots the human tristimulus color space according to: x = X/(X + Y + Z), y = Y/(X + Y + Z). Colors along the periphery of the "horseshoe" plot (spectral locus) are pure, monochromatic, saturated colors. Less saturated colors approach the center becomes (i.e. it becomes whitish or grayish). The straight line across the bottom is called the "non-spectral line of purples." The Chromaticity Diagram software link to the right is an executable file which presents the 1931, 1960, and 1976 versions of the C.I.E. Chromaticity Diagram, in either 2-degree or 10-degree observer retina formats, and adjustable gamma. Here is a very detailed dissertation on the subject of chromaticity, along with software for generating multiple version of the chart.  Please visit Sencore as a gesture of gratitude for allowing
the use of their industry standard C.I.E. Chromaticity Chart. Please visit Sencore as a gesture of gratitude for allowing
the use of their industry standard C.I.E. Chromaticity Chart.
Posted August |
|||||||||||||
 |
|||||||||||||
|
|||||||||||||

|
||||||||||||||||||||||||||||||||||||