|
The
FCC (Federal Communications Commission) has a very useful website set
up for finding information about who owns spectrum licenses around the
country, and what spectrum is available in your county. The
Spectrum Dashboard has four primary methods for searching spectrum
in the United States. You can use the dashboard to find out how spectrum
is being used and by whom. There is an interactive allocation chart
like the big wall charts that the magazines used to give away, only
the nice thing about this one is that it never goes out of date. Of
course the flip side is that if you wanted to research the historical
band allocations you would need to look elsewhere. From the main
page you may perform the following searches. Be aware that the map does
not display where the frequencies are licensed or being used; it is
only good for selecting an area for filtering a search.
-
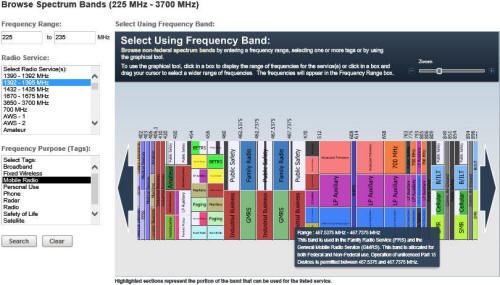
Browse Spectrum Bands: Learn more about the current spectrum
distribution by browsing a chart of the spectrum bands, or by searching
specific frequency ranges.
-
Browse Using a Map: Use an interactive map to find information
on licensees in a particular county or state.
-
Search by Name: Search by "common name" (AT&T, Verizon,
etc.) to learn who holds spectrum licenses around the country. You
can also view a map of spectrum totals by county.
-
Advanced Search: Search by name, radio service, frequency range,
channel block, or call sign to learn who holds spectrum licenses
around the country. You can also view a map of spectrum totals by
county.
Posted October 17, 2013
|