|
|||||||||||||
 |
|||||||||||||
Measuring Distortion in Audio-Frequency Amplifiers
|
|||||||||||||
As with so many topics, the basics of topics like harmonic distortion (and other forms of distortion) in an amplifier circuit has not changed much - if at all - over the decades. Test equipment and circuits being measured get more advanced, but, especially if you are new to the concept, articles like this one on audio-frequency distortion from a 1941 edition of Radio-Craft magazine are as useful today as it was when it was written. When studying, in particular, harmonic distortion, having a knowledge of the Fourier series for common waveforms like triangle waves, sawtooth waves, square waves, and even a semi-circle- shaped wave is especially enlightening since it explains a lot of waveform shapes where harmonics are present. Measuring Distortion in Audio-Frequency Amplifiers
Fig. 1 - Simple amplifier stage with meters for detecting distortion. In the following article (reproduced from "The Aerovox Research Worker" by courtesy of the publishers) the elements of qualitative analyses of A.F.-amplifier frequency distortion, as commonly applied by sound technicians, are mentioned. The more precise methods of making quantitative analyses an then described. at length. The simplest qualitative test for distortion in a class A audio-frequency amplifier stage may be made, as shown in Fig. 1, by applying a signal voltage of proper level to the input and inspecting the circuit for one or all of the following abnormal conditions: (a) Presence of D.C. grid current. (b) Fluctuation of the D.C. plate current, (c) Fluctuation of the D.C. cathode voltage, if the circuit employs cathode resistor bias Each of these indications generally occurs in a positive direction, and each will disappear upon removal of the signal. It must be borne in mind, however, that this method is purely rudimentary in nature and serves only to detect the presence of distortion. One or two of the indications may be absent, depending upon the main cause of the trouble. Qualitative Tests for Distortion The 3 simple indications are well known and frequently used by Servicemen and P.A. .testers who have no equipment suitable for making quantitative distortion measurements, but must, in the course of routine testing, localize distortion without reference to the actual per cent harmonic energy present.
Fig. 2 - Signal plate current.
Audio-frequency amplifier may be checked for distortion.
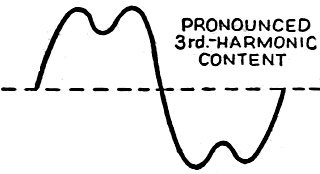
Fig. 4 - Pronounced third harmonic content. The cathode circuit effects noted above are due to fluctuations in the voltage drop across the cathode resistor, occasioned by variations in the D.C. component of plate current. The current indicated by the plate-circuit milliammeter is the average value of the fluctuating "signal" plate current, is identical with the D.C. component, and is the current that produces the cathode resistor drop. These facts may be better comprehended when it is remembered that the fluctuating signal plate current (Fig. 2) is an alternating current, corresponding to the signal, superimposed upon a direct current. It will be evident from the fundamental relations of this combination that the average value of plate current, as indicated by the plate-circuit milliammeter, will be constant in the company of the alternating component under distortionless operating conditions. Figure 2 is a graphical representation of signal plate current. Here, Imax. is the maximum value reached by the fluctuating plate current; Io the zero-signal value; Imin. the minimum value. From these values, it may be shown that the per cent 2nd-harmonic content (often the most troublesome distortion factor) is equal to:
Quantitative methods of checking distortion are harmonic analyses, and are concerned with measurement of the actual amount of energy present in each separate harmonic of the signal frequency (or in the total harmonic content) and establishment of percentages with respect to the fundamental frequency. The most representative methods employed in wave analysis and the apparatus necessary thereto will be described presently. Oscilloscopic Method The cathode-ray oscilloscope is notably useful in the observation of wave shapes. When the horizontal plates of the ray tube are energized by a sawtooth-wave sweep-oscillator-amplifier circuit to furnish the linear time base, and a signal voltage which it is desired to observe is applied to the vertical plates through a substantially flat-response amplifier, the cathode-ray trace will be an exact reproduction of the waveform of the applied signal voltage. An audio-frequency amplifier may be checked for distortion with the oscilloscope in the manner illustrated in Fig. 3. At A is an audio oscillator possessing an output voltage waveform of known purity, B is the amplifier under test, and C is an oscilloscope having horizontal and vertical amplifiers with substantially flat frequency responses. The units are connected in the order shown. It is the purpose of the oscillator to supply a signal of as pure waveform as practicable to the amplifier, and that of the oscilloscope to reproduce the wave-shape of the signal after it has passed through the amplifier. In order that as little distortion as possible be introduced by the instruments themselves, the oscillator used for such a test must be of exceptionally high quality and the amplifiers in the oscilloscope must possess an excellent frequency characteristic. Likewise, the oscilloscope sweep circuit must be uncompromisingly linear in its characteristic. If the amplifier had no distortion at all, the signal it delivered to the oscilloscope would be an exact reproduction of, the input signal waveform. This is never encountered in practice, however, the most efficient amplifier arrangement being beset with the distortion characteristics of its tubes and other components. For observations, a perfect sine wave (or, better still, a tracing of a single cycle from the test oscillator) might be inscribed on the transparent viewing screen of the oscilloscope, and signals from the amplifier matched to this pattern to discover variations from the original shape due to amplifier distortion. In making such a test, it would of course be necessary to adjust both oscilloscope amplifier gain controls in such manner that the maximum amplitude and width of the signal trace coincided with those dimensions of the inscribed pattern. With the low percentages encountered with most well-designed amplifying equipment, it will be difficult to estimate the percentage of harmonic content from the reproduced wave-shape, in the oscilloscopic method, unless the operator makes use of the transparent screens furnished by some oscilloscope manufacturers for the purpose. These screens carry printed patterns of single cycles corresponding to the shapes obtained (variations from true sinusoidal) with various low percentages of distortion. Severe cases would result in images similar to Fig. 4 which is an exaggerated representation of pronounced 3rd-harmonic content. Frequency Bridges
Fig. 5 - Wien bridge circuit.
Fig. 6 - Bridge harmonic totalizer.
Fig. 7 - Arrangement employed in the distortion and noise meters found in broadcast stations. Certain bridge circuits, notably the Wien bridge (see Fig. 5) can be used for the identification of frequencies in the audio-frequency spectrum. If an alternating voltage is delivered to the bridge circuit, the latter may be adjusted for a null at that particular signal frequency. The null point would not hold for the same voltage of another frequency. Thus, the adjustable element of the bridge might be calibrated to read directly in cycles/second. The Wien bridge in its most useful form for this purpose would have its constants so chosen. that the ratio arm, R2 is twice the ohms value of R1 the condensers C1 and C2 are equal in capacity, and the 2 simultaneously-adjustable resistance legs, R3 and R4 are at all positions equal. Under these conditions, the frequency of the impressed voltage at null would be equal to:
Where: Frequency is in cycles/second, R is the resistance of R3 or R4 in ohms, C is the capacity of C1 or C2 in farads. Since the bridge may be balanced for only one frequency at a time, it would appear that any residual voltage indicated by the vacuum-tube voltmeter, M, at null would be due to some other frequency or frequencies (such as harmonics of the fundamental). And this harmonic voltage would be due to the total of harmonic voltages present. As such, the bridge might be connected, as shown in Fig. 5, to the output circuit of an audio-frequency amplifier which is passing a signal from a high-quality audio oscillator. While the device might be used as shown as such a harmonic totalizer, the percentage total harmonic content with respect to the readings of the meter before and after null would not be reliable, nor would its error be uniform for all frequencies. These facts are due to the peculiar nature of the bridge to attenuate various harmonics unequally. Another popular type of bridge harmonic totalizer (due to *U.T.C.) is shown in Fig. 6. Here, 3 legs of the bridge, R2, R3 and R4, contain pure resistance, while the 4th leg contains the shielded parallel resonant circuit, L-C, which is resonant at the test frequency. The transformer, T, like the one shown in the bridge previously described, must have an excellent frequency characteristic. At resonant frequency of L-C, the inductive reactance of the tuned circuit equals the capacitive reactance, the former is canceled by the latter, and the bridge balances as if all 4 legs were pure resistance. Any voltage applied by the circuit to the vacuum-tube voltmeter is then due to harmonics of the test frequency (and it is assumed that these harmonics have been delivered to the bridge by the amplifier under measurement). In operation, the double-pole, double-throw switch, S, is thrown to position 2 and the bridge balanced with the assistance of the vacuum-tube voltmeter, M, as a null indicator. The reading at null (due to harmonics) is recorded. The switch is then thrown into position 1 and R5 is adjusted until the meter gives the same reading (as before at null). The following calculation may be performed to determine the percent of total harmonics from this operation:
or: A dial indicator attached to the potentiometer R5 may be calibrated directly in these percentages. Filter-Meter A very efficient method of measuring total harmonic content in the signal delivered by an audio-frequency amplifier makes use of the arrangement employed in the distortion and noise meters found in broadcast stations. (See Fig. 7.) In this arrangement, the signal from a high-quality sine-wave audio test oscillator is fed into the amplifier under test. The amplifier output is connected to a high-pass filter which removes the test frequency but leaves all of its harmonics. The actual voltage due to the harmonics is then measured by means of an attenuator and vacuum-tube output voltmeter. This measurement is one of total harmonic distortion, but it is entirely possible to arrange additional flat-response amplification with various high-pass filters to remove the various harmonics singly along with the fundamental. Wave Analyzer The wave analyzer, a highly-developed and refined form of heterodyne vacuum-tube voltmeter, provides the most advanced, accurate, and complete means of measuring amplifier distortion by determining the various harmonic voltage magnitudes. The instrument is tunable to the fundamental and any of a series of its harmonics separately, so that waveforms of considerable complexity may be investigated. At the same time, measurements of hum and noise amplitude are made available. In effect it is a highly selective electronic voltmeter.
Fig. 8 - Input multiplier, amplifier, and pad functional block diagram. The representative wave analyzer (General Radio) receives the signal to be inspected through an input channel embracing an input multiplier, amplifier, and pad (see the functional block diagram of Fig. 8). The frequencies accepted by the input channel lie in the range 20 to 16,000 cycles/second - the entire common audio-frequency spectrum. A local heterodyne oscillator stage supplies heterodyning voltage of such frequency variation that throughout the signal input range, an intermediate frequency of 50 kc. may be produced. The dial controlling this oscillator is graduated in the frequencies admitted by the input channel. The fixed-frequency 50 kc. I.F. channel is extremely sharp, containing 3 quartz crystals and is preceded by a balanced modulator, the output of which contains the upper and lower sidebands obtained from the heterodyning process. The carrier is suppressed. The superselective I.F. channel is followed by a 50 kc. amplifier and the indicating instrument. In operation, the wave analyzer is tuned to the .fundamental test frequency and then to the successive harmonics to an extent determined by the amount of frequency tuning range between the fundamental and the 16-kc. limit of the dial. The harmonic amplitudes are indicated directly by the meter. *United Transformer Corp. |
|||||||||||||
 |
|||||||||||||
|
|||||||||||||


|
||||||||||||||||||||||||||||||||||||