|
December 1963 Electronics World
 Table of Contents
Wax nostalgic about and learn from the history of early electronics. See articles
from
Electronics World, published May 1959
- December 1971. All copyrights hereby acknowledged.
|
Raise
your hand if your old stereo system had a "Loudness" control, but you never really knew what it did
- other than change the loudness (my hand is up). Author Rudolph Jacobs addresses the subject in a
technical manner - Fletcher-Munson curves and all - in this 1963 edition of Electronics World
magazine. In a nutshell, in case you don't feel like reading the entire article, Loudness
compensates for the difference in perceived sound intensity level across the audio frequency
spectrum as the reference level is varied. That is to say, it maintains the same perceived listening
level across the audio spectrum whether you have the volume control turned way down, way up, or in
the middle - a sort of volume-dependent equalizer.
The Loudness Control
 By Rudolph A. Jacobs, Jr.
A review of an important concept and a description of a simple
circuit used for loudness compensation.
Back in the early thirties, when the electronic reproduction of sound was in its infancy, the response
characteristic of the human ear became an active subject of investigation. In 1933, the "Journal of
the American Acoustical Society" published a lengthy and exhaustive paper by Fletcher and Munson containing
the results of a study made in this area. Along with a great deal of other information, the paper contained
a family of curves describing average human ear response versus frequency at different sound pressure
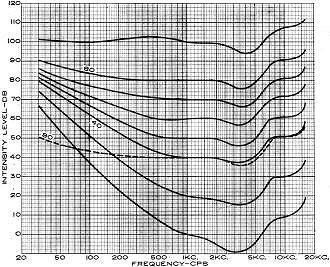
levels. This set of curves is familiar to us as the "Fletcher-Munson Curves." (See Fig. 1.) They have
been published and re-published over the years and used (sometimes misused) innumerable times. Since
the correct application of the data represented by these curves is necessary in order to obtain proper
tonal balance in our sound systems, let us investigate them in some detail.

Fig. 1 - The Fletcher-Munson curves of equal loudness level.

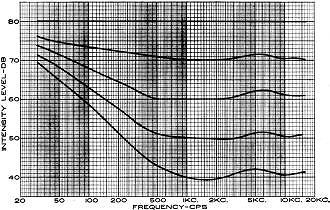
Fig. 2 - Characteristic curves for loudness correction attenuator.
The curves were obtained in the following manner: The researchers produced a tone of 1,000 cps (used
as their reference frequency) at a specific sound pressure level, and had a subject listen to it. They
then produced a tone at another frequency and adjusted its pressure level until the subject said it
sounded just as loud as the 1,000-cps reference tone. The researchers recorded the sound pressure level
of the new tone and then shifted to another frequency, always having the subject compare its loudness
to the loudness of the 1,000-cps tone. By shifting the frequency of the second tone up and down the audio
range, they obtained one equal loudness contour. By repeating the test with a number of subjects they
were able to approximate the response contour of the "average human ear." By shifting the sound pressure
of the 1,000-cps tone in ten decibel steps and repeating the whole process, they obtained equal loudness
contours all the way from the threshold of audibility to the threshold of pain.
The data they obtained is far from ideal. They investigated only the region between 62 and 16,000
cps, assuming, perhaps rashly, that the response trend would continue smoothly from these frequencies
to the limits of audibility. Also, they used close-fitting headsets for taking their direct data, and
then attempted indirectly to convert the results to what would have been obtained by projecting the
sound via a loudspeaker. In this rather dubious process they picked up the peculiar wiggle that appears
in the mid-highs, leaving its validity subject to question. This is especially true when considering
distributed or stereo-type sounds, since Fletcher and Munson themselves attributed the wiggle to diffraction
patterns occurring about the head and ears of a listener facing a point-source sound reproducer.
Although the curves do have these flaws, which we should keep in mind, they still represent the best
data available. Besides when we make our corrections according to their dictates, the result sounds
"right" to the ear and the proof of the pudding is in the eating - so let's proceed.
Significance of Curves
Now that we have the curves, what is their significance?
It is at this point that most of the misunderstandings occur. Before attempting to answer the question,
let's try to pin down two elusive adjectives: "loud" and "soft." What is the power level of a "loud"
musical passage?" There may be momentary rests when it will drop to near zero, then leap up with an ear-splitting
crash! Let us arbitrarily say that when a sustained 1,000-cps tone is produced at our ear at 80 db above
reference (reference level is 10-16 watts per square centimeter), it sounds as loud as a
loud orchestral passage when we are sitting in one of the first rows of the concert hall. At the other
extreme, when we are spending a quiet evening at home reading, with the baby asleep in the next room,
and with our sound system adjusted for very low level background music, that same passage will sound
as loud as our 1,000-cps tone at 40 db above reference. These are, of course, subjective factors and
individuals will vary 10 db or so in their choice of figures for "loud" and "soft," but the ones selected
by the author are close enough to avoid serious objections by most people, so they will be used here.
Now that we have established the range in which we are interested, let us continue by considering
a hypothetical example: The Philharmonic is performing a recently discovered work that we will entitle
"Loud and Equal," in which the melody consists of a succession of tones, all sounding equally loud,
running up and down the audio spectrum, with the 1,000-cps tone at the 80-db level. In other words, they
are creating sound pressures that exactly follow the 80-db loudness contour of Fig. 1. We are listening
to the broadcast on FM at the 80-db level - just as loud as the original sound. Since the transmitting
equipment, pre-emphasis network, receiving equipment, de-emphasis network, and home audio system are
all naturally perfect, with tone controls flat, it sounds just like Philharmonic Hall in the parlor!
We like what we hear, so we run right out and buy the record. However, night falls and out of consideration
for the neighbors, we turn down the volume to the 40-db level and sit back, expecting to hear that "Equal"
piece just as before, but at a nice quiet listening level.

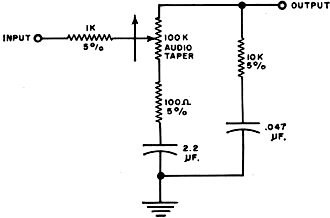
Fig. 3 - Circuit diagram of the loudness control used by author.

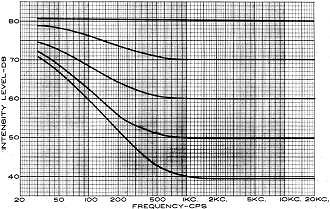
Fig. 4 - Measured frequency response of the Fig. 3 circuit.
What we have really done is taken sound pressures along the 80-db loudness contour and moved them
down to the 40-db level. How does it sound? Terrible! The highs sound fine but over-all it's thin and
weak - no bass. By going to Fig. 1 and superimposing the 80-db contour on the 40-db contour we can quickly
see why. From 700 cps on up, the curves duplicate each other within a decibel or two, so these tones
still sound about equally loud as we go from one to the other. Below 700 cps, however, a pronounced
divergence begins to appear. It is apparent that, to the human ear, the loudness of bass sounds decreases
faster than the loudness of treble sounds as the actual sound-pressure level is uniformly decreased.
At 200 cps, we should have decreased the sound pressure 12 db less than we reduced the 1,000-cps tone
in order for them still to sound equally loud. At 100 cps the difference is 20 db. At 30 cps it's 30 db - a power difference of one-thousand times!
So our piece "Loud and Equal" does not sound equally loud at this lower level. In order for it to
do so, we should have attenuated only those tones above 700 cps by 40 db, attenuating those below this
frequency by reduced amounts: 20 db at 100 cps and only 10 db at 30 cps. What we need then is a control
that will discriminate against the higher frequencies, attenuating them progressively more and more
relative to the bass as we reduce the level, in other words, a uniform loudness control.
Now let's go a step further. We know that when we reproduce an 80-db program at an 80-db level, the
sound system must be flat in order for the program to sound like the original. We have discovered that
when we reproduce an 80-db program at a 40-db level, we must reduce the level of the various frequencies
by the difference between their position on the 80-db contour and their position on the 40-db contour.
Therefore, assuming that an 80-db program is the loudest material we will wish to reproduce without
attenuation, and also assuming that 40 db is the maximum attenuation we will normally desire for any
program, we are ready to define the characteristics of our loudness control.
Loudness-Control Characteristics
Simply enough, it will be flat when set at maximum loudness; then follow the difference between the
80-db contour and each lower contour as the level is reduced; finally reaching the difference between
the 80-db and the 40-db contours at the minimum output setting. These characteristics are plotted in
Fig. 2. (Note that it is the change in the contours of Fig. 1 that gives us Fig. 2. Do not be fooled
by the uniform across-the-board treble rise of Fig. 1 from one curve to the other. It requires no compensation
since it does not change at various levels.)
Assuming we can build a control with the characteristics of Fig. 2, how do we use it? Simply set
the level control so that a program sounds as loud as the original with the loudness control wide open,
after which we need adjust only the loudness control to obtain natural sounding reproduction at any
level we wish.
You may have been following along to this point saying, "This is great for 80-db programs, but what
happens when we run into a program that is 60 decibels in the orchestra? Supposing we are listening
to a piece that we will call 'Moderate and Equal' which runs up and down the 60-db contour, instead
of 'Loud and Equal' on the 80-db contour - then what?" There are no problems as long as the broadcast
or recording engineer keeps his fingers off the controls so that the modulation comes through at the
correct relative level. If we run our loudness control wide open, we will now hear "Moderate and Equal"
going up and down the 60-db contour at the 60-db level - just like the original. If we decide we want
to hear it at 40 db, we turn down the loudness control to 20 db. It won't be exactly right because the
difference between the 80- and 60-db contours is not identical to the difference between the 60- and
40-db contours, but it's close enough. "But," you may ask, "What if I want to listen to 'Moderate and
Equal' at an 80-db level?" In that case, you'll have to bring up the level control and adjust the tone
controls until it sounds right.
A lack of understanding of the loudness phenomenon has in the past led to some strange mores and
way-out activities among audio enthusiasts who had been misled by two mistaken postulates: First, that
only lowbrows enjoy the bass turned way up and, second, that highbrows with golden ears (like us) prefer
their music pure (i.e., tone controls flat). This latter group play their rigs at full concert level
to make it sound right or else sublimate their normal desire to hear full, rich bass tones in favor
of impressive highs.
Now that we recognize the need for following the shift of the contours whenever we change levels,
let us consider some practical means of accomplishing this action.
One way is simply to crank up the bass tone-control knob on the amplifier as we reduce level. This
is better than no compensation, but it has three basic faults: First, the break frequency of most bass
controls does not follow the loudness shift break frequency very well; second, every time we change
level we have to make some kind of guess as to where to position the bass control; finally, and most
serious, typical bass-boost circuitry rarely exceeds 18 db of boost wide open, and as we have seen,
as much as 30 db may be required to achieve the desired compensation.
A separate control which will follow the loudness contour shift over a range of about 40 db is the
only satisfactory solution.
Some loudness controls attenuate over a greater than 40 db range. To accomplish this they either
become quite complex or else do a rather poor job of approximating the contour shift.
The simple control developed by the author, shown schematically in Fig. 3, covers the ample, if not
ultimate, 40-db range. More important, it never deviates from the desired contours by more than a couple
of decibels over this range, as its measured attenuation characteristic (plotted in Fig. 4) clearly
indicates. It requires a low-impedance source (an emitter or cathode-follower of not more than 100 or
200 ohms) and a high-impedance load (about 300,000 ohms). It can be added to almost any preamplifier.
To use the control, set it wide open and adjust the level control so that the program sounds as loud
as the original. Next, set the tone controls for proper balance. These would be set flat if everything
in the system from microphone to room acoustics were perfectly balanced. However, since this is never
the case, some tone-control trimming is almost always necessary. This done, we need not touch the level
control or the tone controls again unless the sound source is shifted to a different power level or
tonal balance.
The loudness control may now be used to achieve any listening level desired, with the program remaining
full and natural sounding at any level.


