|
|||||||||||||
 |
|||||||||||||
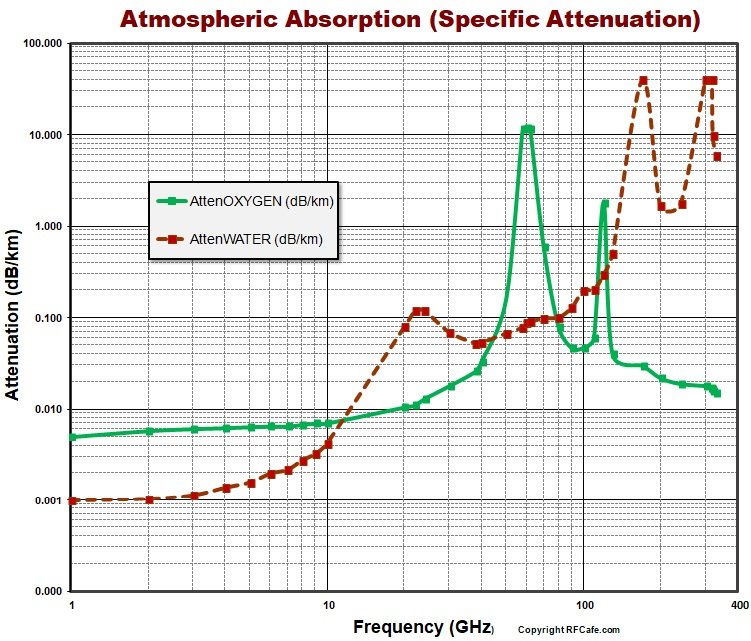
Atmospheric Absorption (Specific Attenuation) |
|||||||||||||
|
Specific attenuation due to atmospheric gases, calculated at 1 GHz intervals, including line centers.
Zenith attenuation due to atmospheric gases, calculated at 1 GHz intervals, including line centers.
Specific attenuation in the range 50-70 GHz at the altitudes indicated, calculated at intervals of 10 MHz, including line centres (0 km, 5 km, 10 km, 15 km and 20 km).
ITU-R P.676-13 (08/2022) Electromagnetic waves are absorbed in the atmosphere according to wavelength. Two compounds are responsible for the majority of signal absorption: oxygen (O2) and water vapor (H2O). The first peak occurs at 22 GHz due to water, and the second at 60 GHz due to oxygen (see graph at bottom of page). The actual amount of water vapor and oxygen in the atmosphere normally declines with an increase in altitude because of the decrease in pressure, so these graphs apply from sea level to around 1 km altitude. Total attenuation through the atmosphere at any frequency through unobstructed atmosphere is the sum of free space path loss, attenuation caused by oxygen absorption and attenuation caused by water vapor absorption. Rain attenuation, when present adds an additional element. For a chart of sunlight power density in the visible light and infrared / ultraviolet region of the electromagnetic spectrum, click here. AttenTotal = AttenFreeSpacePathLoss + AttenOxygen
The ITU (International Telecommunications Union) publishes a document (ITU-R P.676-13) entitled "Attenuation by Atmospheric Gases and Related Effects," which contains some complicated equations and graphs generated from those equations showing atmospheric attenuation. Three of those are shown at the right side of this page. Unfortunately, the ITU does not offer a spreadsheet with the data points in a plottable format. Fortunately (for you), I went to the trouble of extracting the maximum and minimum attenuation versus frequency points from the "Specific attenuation due to atmospheric gases, calculated at 1 GHz intervals, including line centres," graph. The original graph is imported as the background image of an Excel spreadsheet chart, and then all of the frequency / attenuation coordinates were visually read off the chart and entered into a data table. Those points were then plotted as shown below.
Atmospheric Attenuation (Specific Absorption) Chart The above chart was also generated from frequency / attenuation data points picked off a published graph, and were entered into Excel and plotted.
Posted July 3, 2023 |
|||||||||||||
 |
|||||||||||||
|
|||||||||||||


|
||||||||||||||||||||||||||||||||||||