 Thanks
to
Rohde & Schwarz, a leading manufacturer of RF & microwave
test equipment, for allowing this reprint of their "Simplifying
Signal Analysis in Modern Radar Tests" article that appeared in
Microwave Journal's August 2013 edition of Military Microwaves
publication. The R&S
FSW-K6 Signal and Spectrum Analyzer is used to make measurements
and for screen shots. Thanks
to
Rohde & Schwarz, a leading manufacturer of RF & microwave
test equipment, for allowing this reprint of their "Simplifying
Signal Analysis in Modern Radar Tests" article that appeared in
Microwave Journal's August 2013 edition of Military Microwaves
publication. The R&S
FSW-K6 Signal and Spectrum Analyzer is used to make measurements
and for screen shots. Other great articles that appear in the
same edition include:
Receiver Protection in S-Band Radars for Mitigation of 4G Signal Interference,"
"Envelope
Tracking in Next Generation Military Radios," and "RF
Simulators for Next Gen Phased Array Radar."
Simplifying Signal Analysis in
Modern Radar Tests By Darren McCarthy Rohde &
Schwarz Inc., Beaverton, OR The evaluation of direct digital
synthesis (DDS)-based radar systems is challenging for traditional signal
analysis test techniques. This is especially true when it comes to pulse
compression analysis, pulse trend analysis over time and frequency agility
verification. The test tools used to simplify the testing of modern
radar systems are evolving, like the systems they must test. This article
focuses on the evolution of spectrum analyzers from relatively basic
instruments used for measuring traditional pulsed signals to the advanced
test system architectures required for signal analysis of leading-edge
radars. Sophisticated, next-generation radar systems benefit from advances
in digital technology and computational power. The trend is toward the
use of DDS to enable powerful wideband waveform generation capabilities
and digital signal processing in radar baseband electronics in order
to create software-defined radar. When used along with active electronically
scanned antenna (AESA) technology, this offers the following potential
radar system benefits:
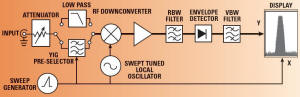
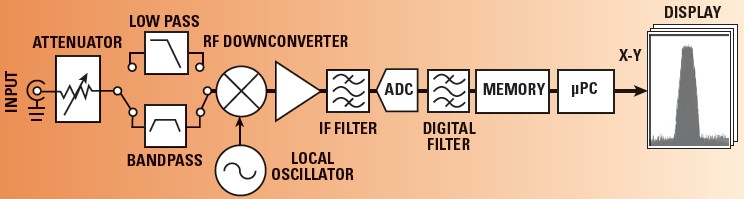
Fig. 1 Traditional swept-tuned spectrum analyzer architecture.
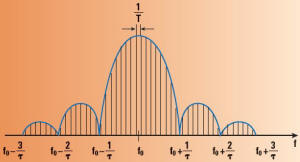
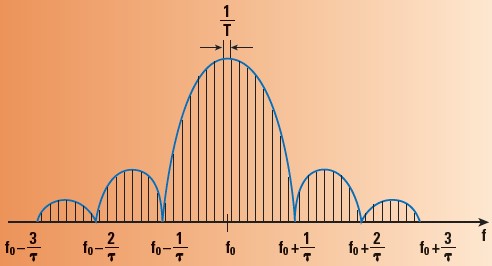
Fig. 2 Typical display of a pulse signal showing pulse
width
τ and pulse interval T.
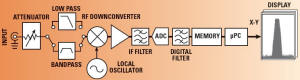
Fig. 3 Vector signal analyzer architecture.
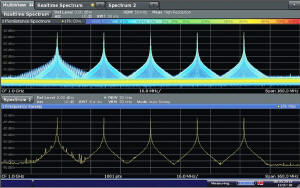
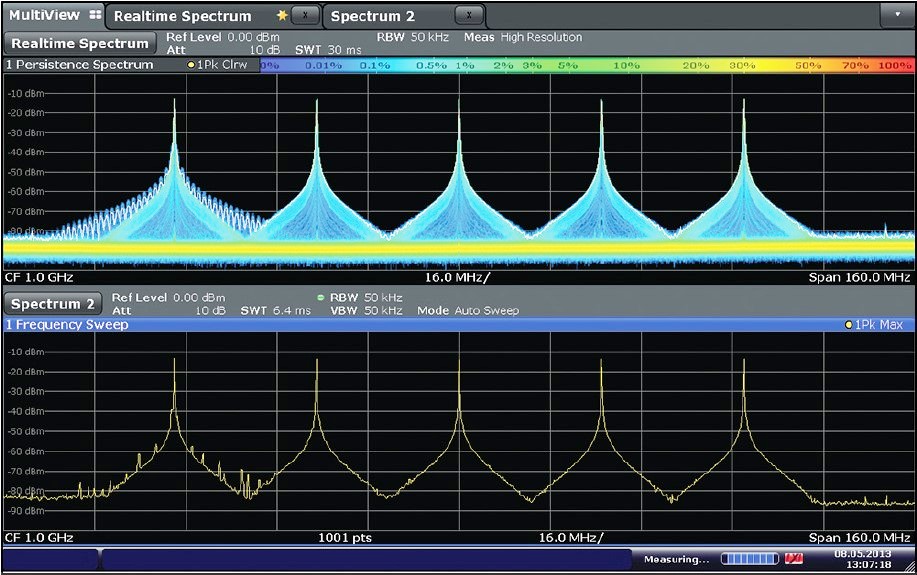
Fig. 4 The Real-time Spectrum display (top) shows a different
spectrum on the lower frequency event, while on the Frequency
Sweep display with Max Hold (bottom) it is not as visible.
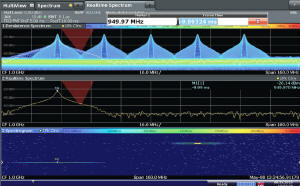
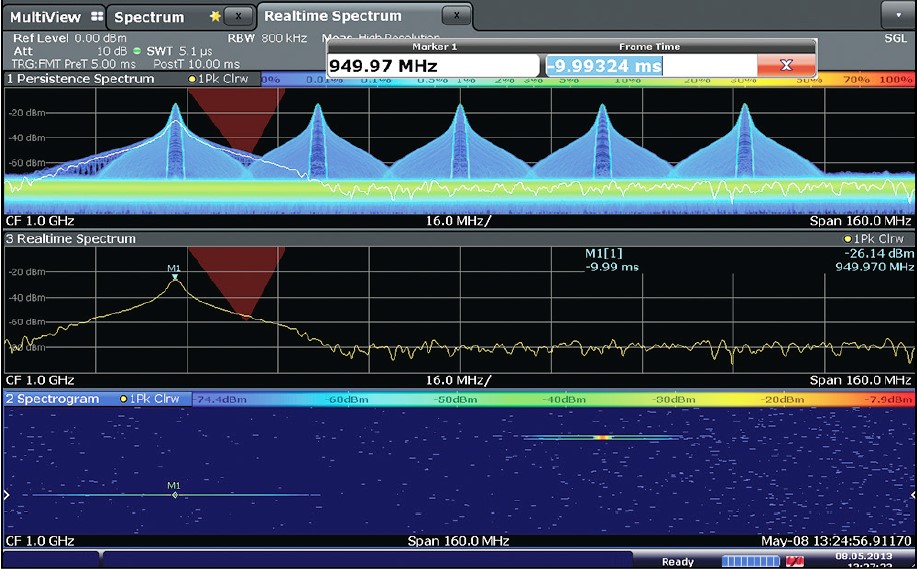
Fig. 5 Triggering on the spectrum enables event isolation
and spectrum vs. time viewing in the spectrogram.
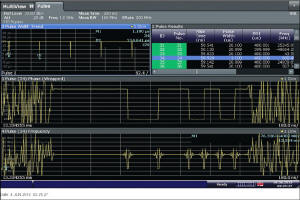
Fig. 6 The unique pulse signal can be isolated and analyzed
completely using the
R&S FSW-K6 pulse measurements option.
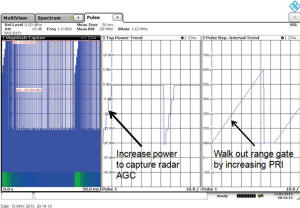
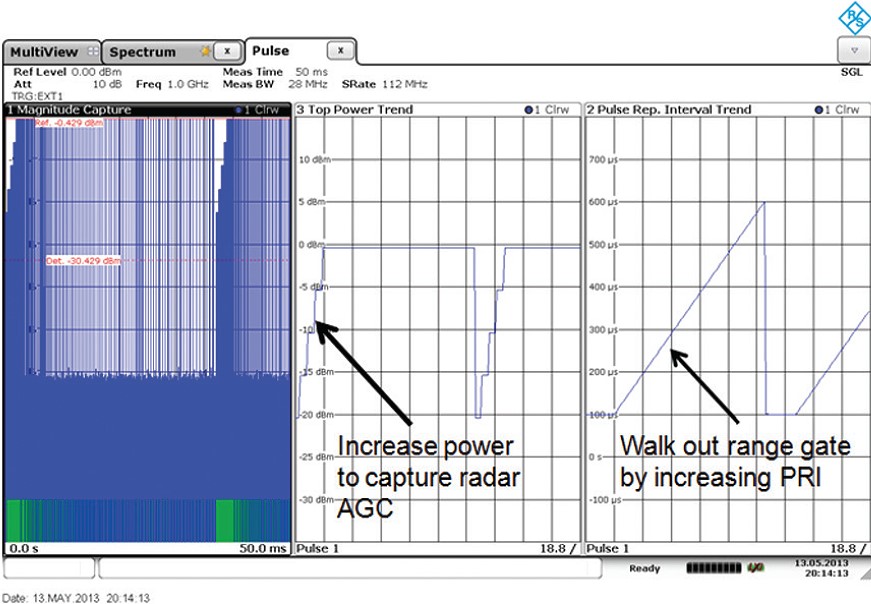
Fig. 7 RGPO test signal including power trend and PRI
trend.
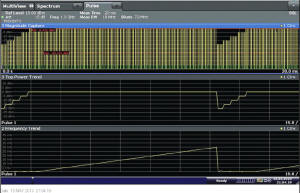
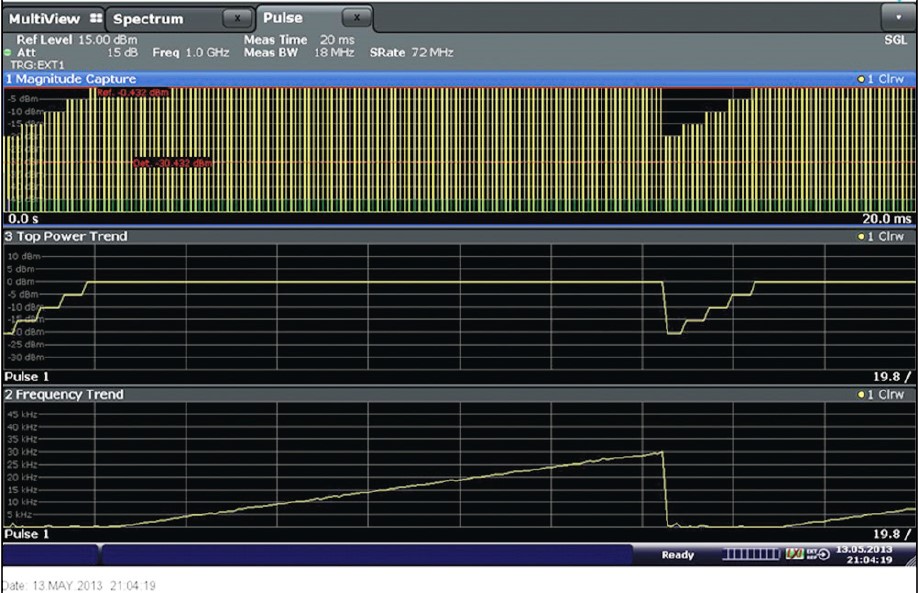
Fig. 8 VGPO test signal including power trend and frequency
trend. |
- Frequency agility – the ability to operate over a wide frequency
band to account for atmospheric effects, jamming, interference and
detection avoidance.
- Waveform agility – the ability to operate pulse compression
(PC) techniques such as frequency and phase modulation on pulse
(FMOP and PMOP) to improve target resolution.
- Mode agility – the ability to change waveforms and sequences
on a pulse-to-pulse basis, including turning PC on and off, changing
the pulse repetition interval (PRI) and staggering PRI to avoid
range ambiguities.
- Multifunctionality – the ability to operate as a radar, a communications
system (radio) and an electronic warfare (EW) asset.
- Rapid technology insertion – the ability to change the function
and performance of the radar through software.
The same DDS technology is also appearing in the EW assets used to deceptively
jam these radar systems. In addition to evaluating radar performance
in a benign environment, the anticipation of DDS-generated radar countermeasures
warrants enhanced receiver testing to assess radar system vulnerabilities.
Spectrum analyzers have long been used for analyzing radar signals.
To perform even basic pulse measurements, however, users must have a
thorough knowledge and understanding of the signal parameters and the
operation of the spectrum analyzer in order to obtain valid results.
With advancements in DDS technology, the pulse characteristics and pulse
sequences produced by radar waveform generators and radar test signals
are becoming more complex. For the measurement of these waveforms, conventional
swept-tuned spectrum analyzers may not be adequate.
BASIC PULSE MEASUREMENTS The main advantage of a traditional
spectrum analyzer is that it can be used to test frequency-dependent
power components over a wide dynamic range. Simple measurements, such
as checking the symmetry of the pulse spectrum, are useful in verifying
radar transmitter operation. An asymmetrical spectrum, for example,
can waste power, generate unwanted spurious emissions and degrade overall
radar system performance. When making measurements using a spectrum
analyzer, especially on signals with low duty cycles, one must be familiar
with the waveform parameters. The proper resolution bandwidth (RBW),
span and sweep time must be set to correctly measure the signal under
test in order to yield informative results. Figure 1
shows the swept-tuned architecture of a traditional spectrum analyzer.
A signal is filtered and downconverted to an IF frequency by applying
various resolution bandwidth (RBW) and video bandwidth (VBW) filters
to the signal while the local oscillator is swept across a frequency
span. Energy versus frequency is plotted on the display. Since
a pulsed signal is not on at all times, its energy will not completely
'fill' the spectrum on a single sweep. Figure 2 shows
the spectral characteristics of a simple pulsed RF radar waveform with
a pulse width
τ
and the pulse repetition interval T; the amplitudes of the spectral
lines are determined by the envelope about the center frequency, f0.
When measuring the frequency spectrum using a spectrum analyzer,
it is possible to display the individual spectral lines or the envelope
of the pulse spectrum, depending on the instrument settings. To display
the spectral lines, the RBW should be set to a value significantly less
than the pulse repetition frequency (1/T). The line spacing is equal
to the inverse of the pulse period (pulse repetition interval) and is
independent of the setting for the sweep time on the analyzer. The amplitude
of the spectral lines is also independent of the RBW. While
this technique can help characterize a relatively stable, and repetitive
pulse signal that does not contain other forms of complex modulation,
there are additional challenges for the assessment of DDS-based radar
systems that employ more complex and dynamic modes such as frequency
agility, variable PRI, pulse compression (modulation inside the pulse),
and dynamically variable pulse trains. In addition, a swept-tuned
analyzer typically provides a zero span function or a video output such
that an oscilloscope can capture the time domain signals. The bandwidth
of the time-domain signal is constrained, however, by the maximum RBW
of the spectrum analyzer. This could be a limitation if the frequency
content of the pulse waveform being analyzed exceeds the RBW.
SPECTRUM ANALYZER ARCHITECTURES FOR TESTING RADARS
Analysis of modern radar signals requires a spectrum
analyzer architecture that exceeds the limited capabilities the traditional
swept-tuned spectrum analyzer. State-of-the-art spectrum analyzers now
incorporate fast Fourier transform (FFT) acquisition and vector signal
analysis operating modes. This class of spectrum analyzer is also called
a signal analyzer. When signal analyzers incorporate runtime sequential
processing of FFTs for functions such as persistency display and triggering,
they are also known as real-time spectrum analyzers. A realtime
spectrum analyzer includes a dedicated processing function between the
analog-to-digital converter (ADC) and the memory to provide sequential
processing of incoming sampled data. One of the benefits of sequential
processing and real-time display technology is the ability to see very
fast events with 100 percent probability of intercept (POI). A figure
of merit for a real-time spectrum analyzer is the minimum event duration
for 100 percent POI. As the radar pulse compression technique tends
to reduce pulse widths below 4 μs, high-performance real-time technology
can improve test confidence. As shown in Figure 3,
a vector signal analyzer has a front end similar to that of a traditional
swept-tuned spectrum analyzer with filtering and downconversion. Once
the signal is downconverted to an intermediate frequency (IF), however,
the entire spectrum is digitized by an ADC and placed into memory. The
time-sampled data can then be converted through FFT and waveform processing,
where the spectrum, time and phase information is extracted and stored
for analysis. Unlike the swept-tuned analyzer, the bandwidth
of a vector signal analyzer is not limited by resolution bandwidth,
but by its IF bandwidth defined by the ADC, the sampling rate and associated
IF filtering. Typical vector signal analyzers have bandwidths ranging
from tens to hundreds of MHz. Acquisitions are seamlessly captured into
memory, and subsequent FFT processing and analysis can be performed
on the acquired signals. The wider IF bandwidth enables analysis of
much faster rise/fall times (and narrower pulse widths), wider bandwidth
signals (e.g. chirps), and the analysis of frequency-agile radar waveforms
across a much wider band. Figure 4 shows the spectrum
of a frequency hopping sequence over a 160 MHz span. There are
two displays shown for comparison. The lower display (Frequency Sweep)
is what is measured using a traditional swept-tuned spectrum analyzer,
with the trace set at Max Hold while the parameters of the sweep are
set to 50 kHz RBW and 6.4 ms sweep time. The five hopping frequencies
are displayed and there appears to be some level of spurious emission
across the band of interest. The upper display (Persistence Spectrum)
in Figure 4 is what can be seen using the features of a vector signal
analyzer. It shows a color gradient scale based on the accumulated occurrence
of the pulse signals. Since the real-time display is based on vector
analysis techniques, the entire sequence of the pulse events is captured
instantaneously. Observing the difference between the two acquisition
techniques, there appears to be a distinctly different spectral shape
appearing infrequently in this operating mode on the lowest of the fi
ve hopping frequencies. Because the spectrum of this event is
different from that of the other pulses, a frequency mask trigger (FMT)
function can be used to isolate the signal (see Figure 5).
Once isolated, a spectrogram display shows that this event appears to
be faster than the other frequency hops. Shown in the bottom of the
spectrogram display in Figure 5 the adjacent event also appears to be
ON for a longer period of time than the triggered spectrum event.
AUTOMATIC PULSE MEASUREMENT ANALYSIS
Because they collect the entire IF band of interest seamlessly into
memory, state-of-the-art vector signal analyzers can now provide pulse
measurement options to completely analyze the pulses and pulse trend
sequences of modern DDS radar signals. For example, the R&S FSW
signal and spectrum analyzer with the R&S FSW-K6 pulse measurements
software option can be used to analyze over 100,000 pulses with time-correlated
views of the spectrum, timing, modulation and statistical properties
of the signal. These are useful functions not readily available on traditional
swept-tuned spectrum analyzers. Furthermore, based on the performance
of the analyzer and independent time synchronization, important pulse-to-pulse
parameters can be measured. The accuracy of the analysis depends on
several of the signal and performance features of the spectrum analyzer:
the signal-to-noise ratio of the signal, the signal bandwidth and measurement
filters applied, the reference clock jitter, and the phase noise accumulated
during the measurement pulse period. An example of automatic
pulse measurement analysis is shown in Figure 6. For this
analysis, the pulse width trend, the results table and the pulse information
are displayed for several hundred pulses captured over a 250 ms
period. The ratio of the signal is 128:1, meaning there are 128 events
with a 20 μs pulse width to a single event with a 1.0 μs pulse
width as shown in the upper right pulse width trend display. The selected
pulse from the results table (the upper right display in Figure 6),
selects the pulse waveform of interest to be displayed for the two trace
display windows at the bottom of the figure (Pulse Phase and Pulse Frequency).
It can now be seen that the demodulated pulse waveform has changed from
a pulsed continuous wave signal to a polyphase pulse compressed Barker
13 waveform for the 1 μs pulse period. This dramatically changes
the radar's resolution on a repetitive basis, but only for a very short
period of time. By utilizing a combination of real-time technology to
isolate the signal of interest and pulse measurement analysis of a single
pulse, a complex pulse signal is easily characterized.
VALIDATING ELECTRONIC PROTECTION (EP) WAVEFORMS
Traditionally, radars that needed EP required a substantial amount
of testing to evaluate their effectiveness against likely deceptive
jamming techniques. As new threats evolve, the test profiles for DDS
radars must also evolve. It is also important to validate the test signals
used to evaluate radar receiver vulnerabilities. Range gate pull-off
(RGPO) is a classic deceptive jamming technique where a jammer tries
to confuse the radar's range tracking system. As shown in Figure 7,
during RGPO the power of a jammer will increase in an attempt to capture
the automatic gain control (AGC) of the target radar. Once captured,
the jammer will then attempt to push or pull the range gate in time
by varying the PRI, forcing the radar to break track with the target.
Pulse compression techniques can be used to reduce the effectiveness
of RGPO, since the radar can sense the type of signal being processed
in the receiver as a foreign (bogus) return and respond either by ignoring
the jammer temporarily or by switching modes and/or frequencies.
One of the more advanced DDS jammer techniques, and potentially
much more troublesome for the radar, is digital RF memory (DRFM). DRFM
directly captures, modifies and retransmits a response that is much
more difficult to detect as a foreign return. DRFM typically modifies
the delay or Doppler of the return to attempt to deceive the velocity
gate of the target radar system. Figure 8 shows
an example of the velocity gate pull-off (VGPO) deceptive jamming technique,
which is similar to the range gate technique. VGPO employs a similar
increase in power to capture the radar AGC, and then gradually shifts
the frequency of the return such that the velocity tracker system breaks
with the target. As DDS-based radars encounter new EW capabilities
and tactics, radar receiver testing will continue to evolve in order
to keep pace. Many of these threats are based on a thorough understanding
of the radar signals in order to provide realistic target speeds (Doppler
walk), for example, to deceive the radar processor. Having the tools
to perform trending and timing analysis of various parameters can provide
confidence in the test process. CONCLUSION
Modern radars have evolved and capitalized on the improvements
in DSP processing and wideband digital converters. This evolution has
dramatically improved the functionality and utility of DDS radars. At
the same time, the test methods and tools have had to evolve in order
to keep up with the requirements for testing these radars. State-of-the-art
spectrum analyzers based on vector signal analysis architectures can
provide the building blocks for simplifying the testing of DDS radars.
By combining real-time functions and automatic pulse software, the sophisticated
new spectrum analyzers are up to the task of simplifying testing and
analysis.
 Reprinted
with permission of
MICROWAVE
JOURNAL® and
Rohde & Schwarz
from the August 2013
Military Microwaves Supplement. ©2013 Horizon House
Publications, Inc. Reprinted
with permission of
MICROWAVE
JOURNAL® and
Rohde & Schwarz
from the August 2013
Military Microwaves Supplement. ©2013 Horizon House
Publications, Inc.
Posted September 6, 2013
|