|
February 1960 Electronics World
 Table of Contents
Wax nostalgic about and learn from the history of early electronics. See articles
from
Electronics World, published May 1959
- December 1971. All copyrights hereby acknowledged.
|
Audio distortion is most
often expressed as total harmonic distortion (THD) as opposed to intermodulation
distortion (IMD). As the name suggests,
THD is a measure of harmonic power content relative to the fundamental frequency
(a single tone) from which harmonics are created.
IMD on
the other hand, is generated from the nonlinear mixing of two or more tones, with
the products being non-harmonically related to the original tones. The author's
discussion of audio frequency IMD applies equally to radio frequency IMD. Intentionally
generated harmonic components can enhance sound quality due to being
consonant,
whereas IM products create
dissonant
tones not directly related to the originals. Audio amplifier frequency vs. power
specifications typically include the sum of total harmonic distortion and noise
(THD+N), signal-to-noise ratio (SNR), crosstalk between channels, response flatness,
but at least for consumer grade products rarely include intermodulation distortion.
That is probably because very few people buying stereo systems - even very expensive
models - have any idea what THD refers to and would be totally clueless about IMD.
Intermodulation Distortion: What it is and how it's measured
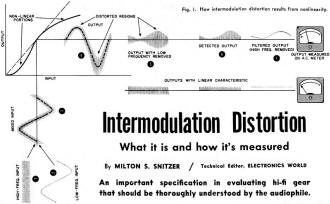
Fig. 1 - How intermodulation distortion results from nonlinearity.
By Milton S. Snitzer / Technical Editor, Electronics World
An important specification in evaluating hi-fi gear that should be thoroughly
understood by the audiophile.
The earliest and still most common method of checking distortion in hi-fi gear
is by the use of a single input frequency in a harmonic distortion check. (See "Harmonic
Distortion - What It Is and How It's Measured" in our November, 1959 issue.) Although
this method is easy to use and readily duplicated, it may not tell very much about
how an amplifier would handle a somewhat more complex input. For example, if we
were to apply a mixture of two input signals, one at a low frequency and the other
at a high frequency, and we were to check how the amplifier handles these simultaneously
and what interactions there are between them, then we would have a better indication
of how the even more complex speech and music signals would be handled. This is
exactly what we do when we measure intermodulation distortion (IM).
There is currently some disagreement on the value of an IM measurement. There
are many in the field who feel that a total harmonic distortion (THD) test made
over the entire frequency range adequately describes the amplifier's distortion
performance. Following this reasoning, recent standards have been set up for THD
measurements but not for IM measurement. Despite this, a good many manufacturers
quote IM distortion figures so it is important to understand these figures and how
they are obtained.
How IM Is Produced
When two different frequencies are applied to a perfectly linear device (one
whose output varies directly in accordance with the input), then the output of the
device contains only these two frequencies. On the other hand, when there is any
non-linearity, one of the signals is changed or modulated by the other. (See Fig. 1.)
When this modulation takes place, additional sideband frequencies are generated
just as they are in the modulated stage of a radio transmitter. These additional
sideband frequencies are not harmonically related to either of the original frequencies.
For example, if a large 60-cps signal is combined with a small 6000-cps signal in
a non-linear device, the additional frequencies of 5940 (6000-60) cps and 6060 (6000+60)
cps are formed. What is more, harmonics of the original two frequencies combine
with each other to produce still more "sum and difference" signals. None of these
additional signals was present originally, so that we have now introduced distortion.
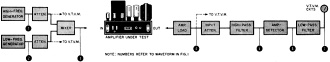
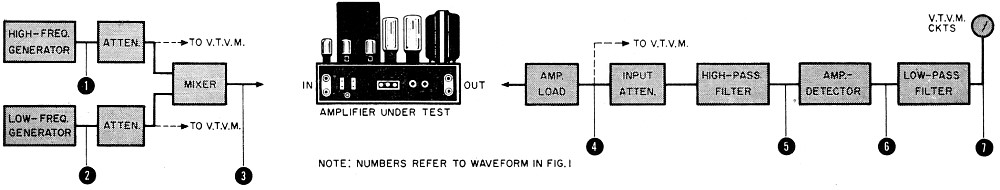
Fig. 2 - Functional block diagram of IM analyzer. Waveforms
at various points in the instrument are shown in Fig. 1
The amount of this distortion is the r.m.s. sum of all these added sideband signals
expressed as a percentage of the modulated signal. In the example just given then,
if the square root of the sum of the squares of all the sideband frequencies is
0.1 volt and the amplitude of the 6000-cps signal alone is 5 volts, then the IM
distortion is 2 per-cent.
Audible Effects
There are two audible effects of IM distortion: one of these is the result of
the amplitude modulation that occurs and the other is the result of the unharmonically
related added frequencies, Assume you are listening to a Bach Chorale with the sopranos
being accompanied by a loud, bass passage on the organ. If your equipment has high
IM distortion, the voices may have an unpleasant, "fluttery," and unclear sound
because these high frequencies are being amplitude modulated by the low-frequency
tones of the organ.
In addition to this effect, any time that you listen to any combination of tones,
or even a single tone that is anything but a simple sine wave, the added frequencies
due to IM distortion introduce a roughness or harshness that seems to "muddy up"
the original tones. Any added frequencies, whether harmonically related or not,
constitute distortion. But when these frequencies are not harmonically related,
then the audible effects are quite unpleasant.
Limits of IM
 In measuring IM distortion it is common to apply
to the equipment under test a large low-frequency signal along with a small high-frequency
signal. The usual ratio between the two amplitudes is 4 to 1 (12 db). Low frequencies
in common use are 40 cps, 60 cps, 100 cps, and 150 cps; high frequencies in common
use are 3000 cps, 4000 cps, 6000 cps, and 15,000 cps.1 Depending on which
frequencies are used, and their related amplitudes, different IM distortion figures
will be obtained. Therefore, it is important to state just what frequencies and
amplitudes are used in a given test when specs are quoted. It is also important
to state the power level at which the measurement is made. In measuring IM distortion it is common to apply
to the equipment under test a large low-frequency signal along with a small high-frequency
signal. The usual ratio between the two amplitudes is 4 to 1 (12 db). Low frequencies
in common use are 40 cps, 60 cps, 100 cps, and 150 cps; high frequencies in common
use are 3000 cps, 4000 cps, 6000 cps, and 15,000 cps.1 Depending on which
frequencies are used, and their related amplitudes, different IM distortion figures
will be obtained. Therefore, it is important to state just what frequencies and
amplitudes are used in a given test when specs are quoted. It is also important
to state the power level at which the measurement is made.
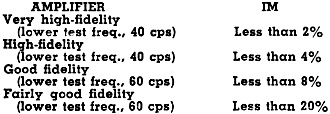
The amount of IM distortion that should be present in top-quality hi-fi equipment
has been the subject of much discussion. According to one authority" the following
arbitrary grouping is given (above, right):
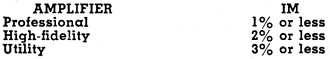 Recently the Heath Company has set up its own
standards for IM distortion limits on power amplifiers. Its groupings, using test
frequencies of 60 and 6000 cps at a 4:1 ratio, are as follows (right): Recently the Heath Company has set up its own
standards for IM distortion limits on power amplifiers. Its groupings, using test
frequencies of 60 and 6000 cps at a 4:1 ratio, are as follows (right):
In our own lab-tested reports as well as in the specifications quoted by a large
number of companies in the field, an IM distortion figure of 1 per-cent is used.
If we find that an amplifier will not produce its full rated output power at 1 per-cent
IM, then we down-rate the unit. Admittedly this is an extremely strict specification
to meet but we feel that it is fair provided all units are subjected to the same
criterion.
IM Compared with THD
In general, when an amplifier has low intermodulation distortion, it also has
low total harmonic distortion (THD). When the IM is high, so is the THD. However,
it must be remembered that these two methods of measuring distortion are quite different,
so it is logical to expect that the percentage figures for IM and THD will not be
the same.
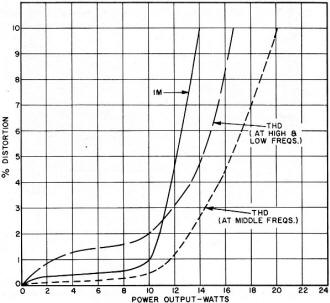
Fig. 3 - Relation between IM and total harmonic distortion
in hypothetical amplifier.
The relation between IM and THD in a hypothetical amplifier is shown in Fig. 3.
These curves are fairly typical. Note that at low power outputs (up to about 11
watts in this case) the IM distortion is less than the THD, as measured at the extremes
of the frequency range to be covered (say 20 or 20,000 cps). At 10 watts output,
the IM of this particular amplifier is 1% while the THD is 2%. It is quite accidental
that these two figures, which we use as our own standards, occur at the same power
level. But observe what happens at the higher power levels. First, the IM goes upward
a little more suddenly than does THD. For this reason, many feel that the IM measurement
is a much more sensitive indication of amplifier overload. Second, the two distortion
curves cross each other so that the value of the IM becomes higher than the value
of the THD.
If the harmonic distortion measurements are made at the mid-frequencies (400
or 1000 cps) , our amplifier is seen to produce much less THD. Under these conditions,
it is not uncommon for the value of THD to be less than the value of IM at all power
levels. In the case of our hypothetical amplifier, an output power of 13 watts is
produced at a THD of 2 per-cent. At this power level, the IM is close to 8 per-cent,
or almost 4 times as great.
It is quite possible to have a totally different relation between IM and THD
than is shown in Fig. 3. The design of the amplifier being checked, and particularly
how it overloads, may change this picture markedly.
IM Analyzers
Although IM distortion can be measured with separate audio generators, filter
circuits, oscilloscope or meter indicators, common practice is to combine many or
even all the functions needed into a single instrument. This instrument may be called
an IM analyzer. A block diagram of all the functions performed by such an instrument
is shown in Fig. 2.
Two stable audio generators are used, one of these produces the low frequency
and the other produces the high frequency required for the test. In some instruments
these frequencies are adjustable, in others they are fixed. The two signals are
then fed into attenuators for isolation and for adjustment of the amplitude ratio
(usually 4 to 1). Some units permit the user to switch internal v.t.v.m. circuits
in at these points to measure the relative amplitudes of the two audio signals.
After suitable mixing, the combined signal is applied to the input of the amplifier
to be tested.

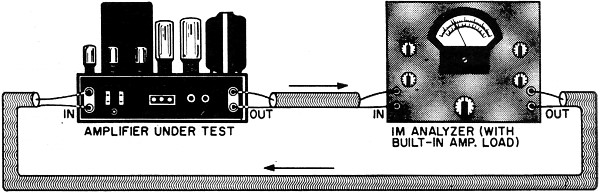
Fig. 4 - Test setup employed for checking IM distortion
of a high-fidelity amplifier.
The amplifier is terminated in an output load resistor. Some IM units even have
such loads built in for limited power use. The v.t.v.m. is then switched across
this load so that the output power may be monitored. It is common to operate the
amplifier "wide open," and simply keep increasing the mixed input signal until rated
power output (or whatever power output level is desired) is obtained. See Fig. 4.
In this regard, it is important to use the same peak output voltage as would
be obtained under single-frequency conditions, since it is usually at the voltage
peak that distortion is generated. If the amplifier is delivering 4 volts of low
frequency and 1 volt of high frequency at the same time, its total output voltage
would be 5 volts. The distortion would be equivalent to that produced by a 5-volt
signal. The power that should be produced by such a signal is E2 (52,
or 25) divided by the load resistance. On the other hand, the true power (as indicated
by a voltage measurement taken across the load) is only 42 plus 12
(16 + 1, or 17) divided by the load resistance. This means that the indicated power
output must be multiplied by 25/17 (or 1.47) when testing for IM under these conditions
to obtain an equivalent sine-wave output power. Hence, if the voltage measures 8
volts across an 8-ohm load, the true power is 8 watts, but the equivalent sine-wave
output power is 1.47 x 8, or 11.8 watts.
The amplifier load signal is then applied through an input attenuator to a high-pass
filter. This circuit removes the large-amplitude, low-frequency signal and passes
on the high frequency. If the amplifier under test has IM distortion, the amplitude
of this high-frequency signal will vary, perhaps as shown at the upper waveform
No.5 in Fig. 1. If the amplifier has no IM distortion, the amplitude will
be constant, as shown in the lower waveform.
The high-frequency signal is then amplified and detected. (See waveform No.6.)
After detection, the signal is fed to a low-pass filter which removes the high-frequency
ripple. Now the amplitude variation shows up clearly as a low-frequency signal (upper
waveform No.7). Had there been no IM distortion, the output here would be pure d.c.
The remaining low frequency, representing the distortion, is then applied to the
a.c. v.t.v.m. circuits for measurement. Since this meter had previously been adjusted
for full-scale reading with the undistorted high-frequency applied, it will now
read directly the percentage value of the intermodulation distortion.
IM distortion measurements, taken in accordance with any standard method such
as the one described, allow an important specification to be quoted for evaluating
high-fidelity equipment.
1 This method is the one specified by the Society of Motion Picture & Television
Engineers.
2 "Radiotron Designer's Handbook" Fourth Edition - edited by Langford-Smith.
Posted June 7, 2024
(updated from original post
on 7/9/2018)
|