Radio Astrology |
|
My interest in astronomy really took off while I was living in the barracks at Robins AFB, Georgia, back in the 1979-1982 timeframe. Being in the middle of a huge airfield is not the best place for observing because of all the lights. I discovered that the roof of the three-story barracks was a good place to escape the human and motorized traffic. The lock on the roof access hatch in the stairwell had been left off so I would drag my telescope up there when the skies were clear. The heat coming off the roof would wreak havoc with viewing, but my telescope was not all that great anyway. One time while headed to the roof, equipment in tow, a guy I knew stopped me to ask what I was doing. When I explained about my interest in astronomy, he got really enthusiastic and began tell me about how he followed the stars, too - as an astrologer. After politely indulging his story, I continued skyward. From that time on I have been careful to always emphasize "astronomy" as opposed to "astrology," lest another such encounter ensue. Historically, there has been a close connection and melding of interest in heavenly objects by both the scientific and religious communities. Indeed, most of the earlier astronomers of note were clerics whose resources were availed to them by the church. Monks were regularly kept off the streets and out of trouble by being busy calculating and/or copying volumes of logarithm tables and science texts. As long as one did not suggest that Earth was not at the center of the universe or that some point of light did not follow a perfectly definable path across the sky (although the word "planet" means "wanderer", describing the irregular prograde and retrograde motions), life was pretty good for those involved. Even today, there are serious and credible astrophysicists who suspect that the relative positions of plants, moons, and clustered masses of matter (e.g. asteroid belts) might exert some influence, even if miniscule, on bodies in the solar system. Many attempts have been made to correlate solar activities - prominences, flares, coronal mass ejections - with the collective positions of said objects. Some have sought to determine whether influxes of cosmic radiation directly and measurably affect Earth's atmospheric activity (apart from solar influences). To date, I do not recall any confirmed results, but once the measurement of gravitational waves has been improved, almost certainly that will be an area of success. Efforts and conclusions such as what is reported here are not to be scorned, but regarded as legitimate pioneering steps toward a truly scientific approach to determining how to possibly predict atmospheric propagation of electromagnetic energy. Radio Astrology - Explanations of some propagation phenomena may be "far-out" indeed.
By Edward P. Tilton,* W1HDQ AS-TROL-O-GY - The divination of supposed influences of the stars upon human affairs and terrestrial events, by their positions and aspects. Even Webster seems anything but convinced. Similarly, the idea that the positions of the planets of the solar system affect (trigger, cause?) the formation of sunspots has received less than enthusiastic acceptance by the scientific community. The proposition is far from new, as can be determined by a search of papers in this field in any major library. It antedates any consideration of radio propagation connotations by many years. The hold the sun has always had on the minds of men, coupled with the ancient art of astrology, would assure conjecture and serious study of planetary influences and solar activity in connection with all manner of human and natural ups and downs. Weather trends, war and peace, tidal history, crop abundance and failure, frequency and severity of earthquakes - these are some of the more obvious cycles that have been plotted against solar activity and/or the positions of the planets, over many years. No less a figure than Herschel attempted to show a correlation between sunspot numbers and the price of wheat on the London market, in 1801 - before the existence of a "sunspot cycle" had been discovered. Though often quoted, his premise was not very solidly based. Association of planetary configurations with variations in radio propagation across the North Atlantic was shown by Nelson in work that began over 30 years ago.1 Despite the fact that use of his planetary position plots in commercial communications scheduling between this country and Europe netted better reliability than the then-new NBS Propagation Predictions, his ideas were not widely accepted. Perhaps this was because he did not say why they worked; only that they did, and admittedly at less than 100-percent accuracy.
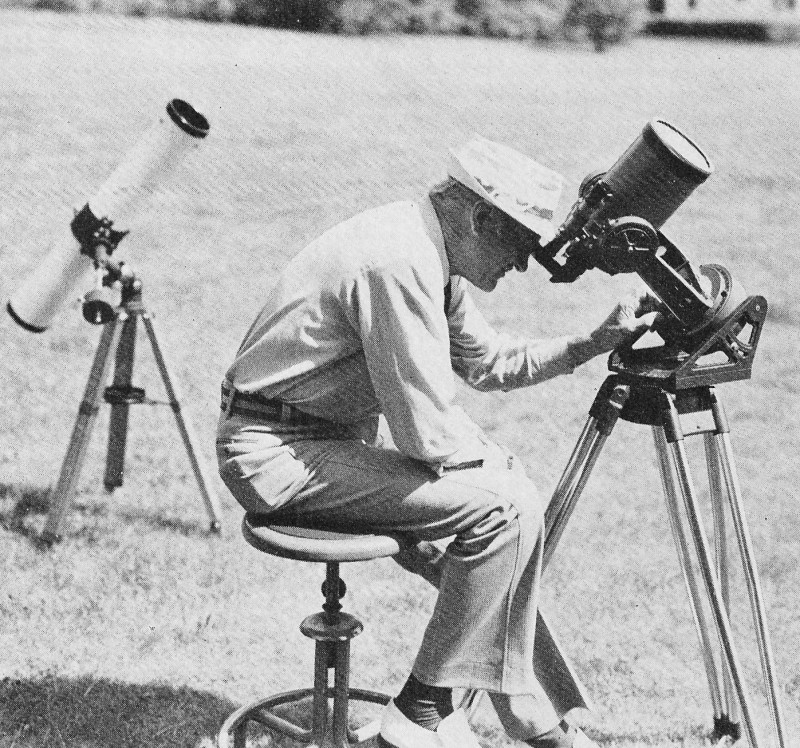
The author, using the Celestron and solar filter, here wears a brimmed hat to exclude direct sunlight. Instrument to the rear is a 5-inch reflector-type telescope used for projection viewing. Never use any device for direct viewing unless it is equipped with a filter certified as safe.
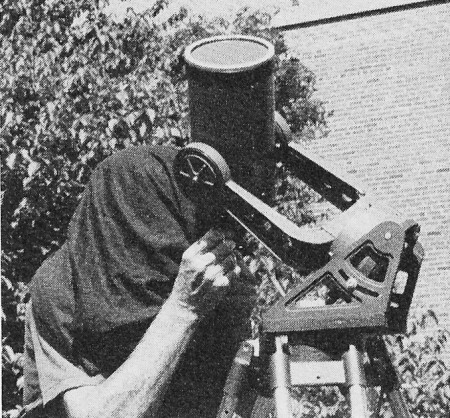
Direct viewing of the sun, using Celestron 5, fitted with maker's solar filter for eye protection. Dark hood, shutting out direct sunlight, improves visual acuity. Sunspots-and-planets theories have suffered at the hands of detractors whenever they have appeared in print, inevitably becoming a favorite letters-to-the-editor theme. K. D. Wood, writing in Nature,2 discussed the effects of the tidal planets, Mercury, Venus, Earth, and Jupiter, on solar tides and sunspots. Oddly, he eliminated the effects of Mercury "because of their very short period of about 3 months, compared with the period of the sun-spot cycle, about 11.1 years." This open invitation to challenge the Wood findings was picked up by Okal and Anderson, in another "Letter To Nature."3 Putting Mercury into the picture, they suggest that Wood's correlation is "an artifact of the calculation." They take Wood to task for his three-planet solar system, but then go on to "restrict ourselves to Mercury, Venus, Earth, and Jupiter. Mars, Saturn, and the other outer planets can be shown to have trivial contributions compared to the above planets." In this same reference the authors give the "Jupiter Effect" theory (prediction of disastrous earthquakes and phenomenal sunspot numbers to come in 1982, with a major planet alignment)4 a going-over. In this confused light, it may be of interest to see what Nelson had to say, and how his methods stack up today. The Nelson Theme The basic Nelson idea was that heliocentric positions of the planets 90° or multiples thereof apart are associated with disturbed propagation across the North Atlantic. He drew this conclusion after examination of years of operator logs from transatlantic communications circuits and plotting the heliocentric longitude for the dates involved. He also studied major disturbances, from records going back to the 1930s. His concluding words are worth repeating here. "Research conducted at this observatory since 1946 has quite definitely indicated that sunspots themselves are not the full answer to the problems that are manifest. There is very strong evidence that other forces are at work. Study of the planets in propagation analysis has netted encouraging results, and shows sufficient promise to warrant further and deeper study." (Italics ours.) This is a conservative statement of the case, indeed, when his results are compared with those arrived at by more conventional methods, even to this day. Nelson's work and years of amateur radio experience, show that propagation forecasting based on sunspot number and 27-day recurrence data alone "will not cut the mustard." Yet this is how most forecasting is still done. The ambitious and knowledgeable amateur may be able to do better. We can and should try anything. The "bees can't fly" approach has no place in our picture. With this in mind, we look back at high spots in years of propagation watching, this time keeping an eye on the planets, too. Some of the experience is recent, and here observation of the sun is included. Other dates and times were dredged up from the dim past, when some of Nelson's data from the 1940s jangled our memory bells. Encouragement to take up this work was given by almost lifelong friend Mel Wilson, W1DEI/W2BOC, who has been at this sort of thing for years. Mel even provided forms for planet plotting without a protractor. See Fig. 4. The only other tools needed were a pencil, a straight-edge, and yearly editions of The American Ephemeris and Nautical Almanac. This book can be purchased from the Government Printing Office and some bookstores. Nelson used the same data source in the 1940s. An inexpensive electronic "button box" will speed the simple arithmetical work. As Nelson did with transatlantic operator logs for the years 1940 through '49, we have plotted planetary configurations for Mercury, Venus, Earth, Mars, Jupiter, and Saturn. The Mercury chore is considerable, as this small close-in planet makes more Nelson configurations than all the others put together. Instead of plotting everything for years, we looked for periods when there were marked anomalies - mainly relatively high levels of solar activity at times when low activity is the norm, as it is in the current trough between Cycles 20 and 21. Nelson apparently ignored the moon in all this, which appears logical until you look at the many events that seem to be related to the moon's position. More on this later. Examination of his many planet plots (in reference 1) appear to indicate another possible refinement of Nelson's methods. Where the fast-moving planets (especially Mercury) are involved, his configurations are not exactly 90-degree multiples. There is no way to tell for sure, from his text, but it would appear that he assumed the disturbance effect to be simultaneous with an event on the sun. It is now known that disturbances (high absorption, auroras) result from slow-moving particle radiation that may take several days to reach the earth's atmosphere. When this factor is taken into account the Nelson method looks more convincing. A key point in Nelson's findings is that Jupiter and Saturn are of major importance. When these, the two largest planets, are in 0, 90, 180, or 270-degree relationship (he says), the effects of configurations with other planets are greatest. These two move slowly with respect to one another, so the effects of their alignments are long-lasting. When you consider that they were in exact 90-degree configuration in early February, 1976, and not far from this relative position for three months either side, you wonder if this could have anything to do with the occasional anomalous behavior of the sun and the ionosphere in this supposed bottom of Cycle 20. When Predictions Went Wrong Nelson did not say why certain planetary configurations produced disturbed conditions, but most discussions, including those referenced earlier, have concerned gravitational effects. Looking at the complex machine that is our solar system,5 we may think of other possible causes and effects as well - magnetic fields, blocking, deflection, and focusing, to name a few. But without straining for explanations, let's look at periods in the last year when we've encountered marked solar and propagation anomalies. Another definition here: "Anomaly - deviation from the common rule." For about two years now the writer and several associates have been charting WWV propagation information, monitoring various signals and frequencies, and observing conditions on the sun. The last pursuit has gone through several stages of increasingly sophisticated methods and equipment. In general, the labor has confirmed the worth of regular observation and record-keeping for anyone who is really interested in propagation variations. It has also shown that there are times (just as in weather forecasting, and perhaps for similar reasons) when accepted methods do not work. Then the consistent observer feels strongly that he has been missing something he should have seen. Several periods in which propagation surprises occurred are detailed below.
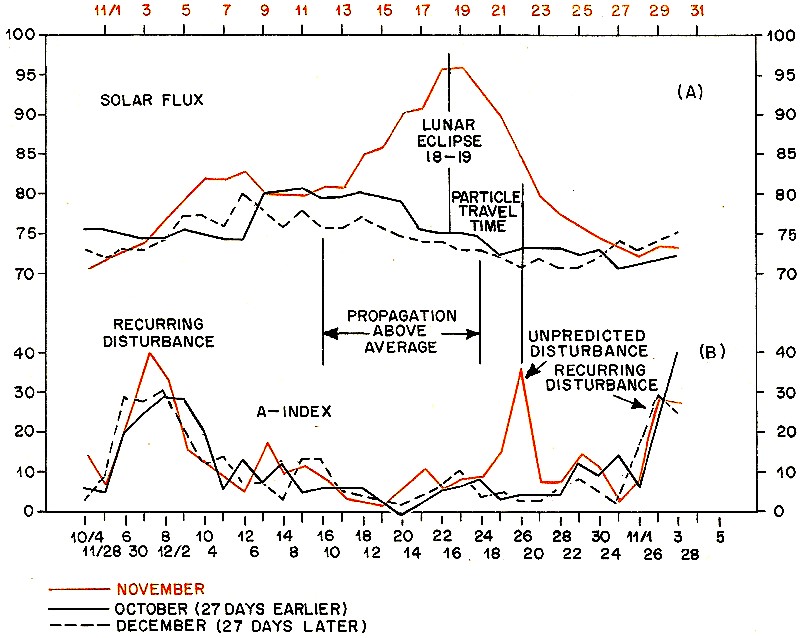
Fig. 1 - Solar-flux and A-index curves for November, 1975 (red lines) with similar data for periods 27 days before and after (black lines). It is apparent that 27-day recurring phenomena play important roles, but there is one major event that has no "history." The curves for the 17th through 19th and 21st through 23rd describe an unpredicted propagation happening of major proportions.
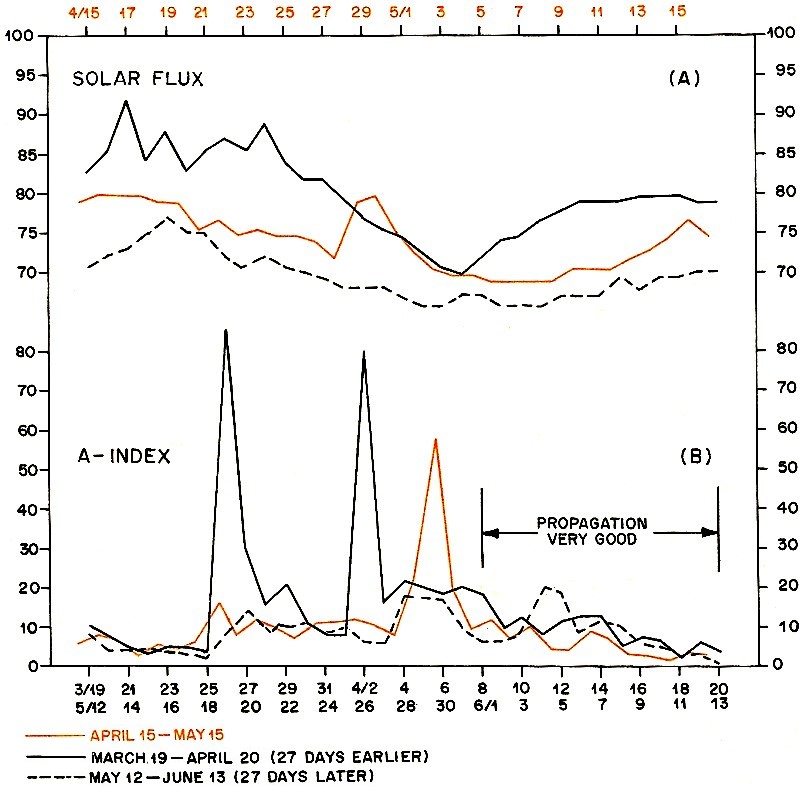
Fig. 2 - The period April 15 through May 15, 1976, red lines, and the preceding and following 27-day-related periods, show several examples of predicted and unpredicted propagation events of major interest.
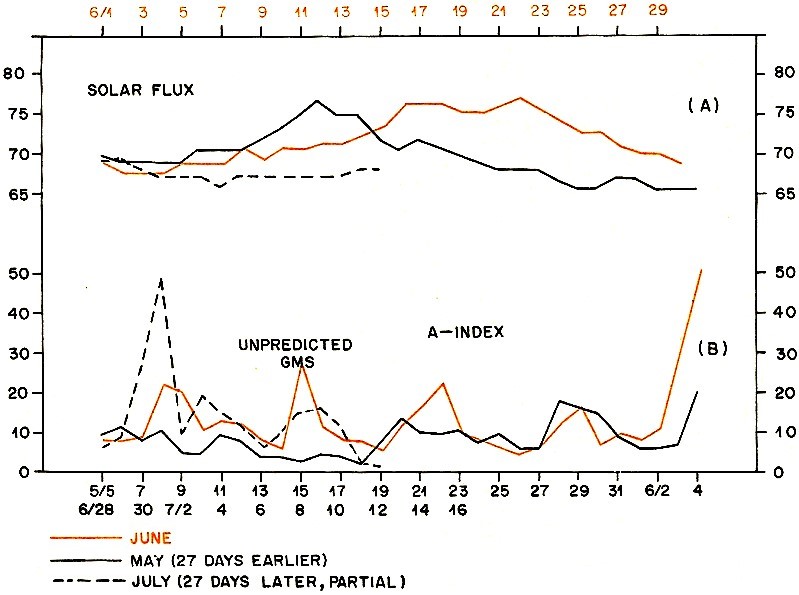
Fig. 3 - Flux and A-index curves for June, 1976, and related periods before and after show several minor propagation variations not entirely explained by 27-day recurrence phenomena. July data were incomplete at the time of preparation of this chart. In Fig. 1 the 2800-MHz solar flux, A, and the geomagnetic A-index, B, as broadcast by WWV during November, 1975, are shown in red lines. The same data for periods 27 days before and after are shown in black lines, with the dates displaced so that recurring phenomena line up vertically. Early in the month we see a recurring disturbance (left side, Fig. 1B). This one had a long history, and the before-and-after peaks line up closely with the major disturbance of Nov. 3. No surprises here. It was in everyone's predictions. Next come several days of moderate or low disturbance. Again, the three A-index curves coincide closely. There was very good propagation in the middle of the three periods, with rising or above-average solar flux and low A-index. Skipping over to the 23rd, we see more good A-index tracking through the balance of the month. Predictions for all these parts of the period made the propagation seers look good. But you, gentle reader, could have done at least as well, with a little practice and use of the "DXer's Crystal Ball."6 The interesting part begins with the steep rise in the solar flux, Nov. 13 on. You don't see flux readings rocket up like that every month - and when they do, something more than ordinary 27-day influences are at work. Professional predictions contained no hint of what was to come here. The increased solar activity earlier in November had already brought new life to the 21-MHz band, which began to sound like it had about three years ago. There was even some low-latitude DX activity on 28 MHz. From the 14th on, 15 was open to Europe from most of North America for several hours, and 10 was getting hot too, though for shorter times. Ten-meter skip shortened up to about 1600 miles within this country, and there was 15-meter F-layer propagation between Connecticut and Florida for the first time in two years. Two large and active sunspot groups were visible with the simplest projection methods - but their positions identified them as being of the "old cycle." What brought Cycle 20 back to life so spectacularly? This writer is not about to say, except to note that there was a total lunar eclipse the night of Nov. 18. It ran over into the 19th, Universal Time. So did the solar flux peak. At 96, it was the second-highest level reached in 1975. The year's averag e was 21 points lower. Most interesting of all is the way Nov. 18-19 towers over the comparable periods 27 days before and after. It was not predicted - but in retrospect we may feel that it should have been. We pay for conditions like that eventually, and the bill for this spree came due Nov. 21. Payment was made by 80- and 40-meter operators in the ARRL Sweepstakes Phone Weekend, despite professional forecasts for above-average propagation for the whole period from the 12th through the 24th. The author was caught in this one too, though he should have known that the rapid flux rise would exact its toll. But for at least a year back there had been no appreciable disturbances in the 27-day-related periods. Even the WWV forecasters were caught with their K-index trends down. It seemed that they could not believe what geomagnetic-field readings were telling them. Here is the record: "K-index at 1800 Nov. 20 - 3, expected to decrease." It didn't. At 2400, and 0600 next day, same thing. At 1200 the 21st, "4, expected to decrease." They won this one; it did, but not for long. WWV was unreadable in Connecticut by the time the 1800 information was on the air. It was that bad, already, but worse was to come. At 2400 and 0600 on the 22nd, the K-index was "3, expected to decrease." It didn't. The 1200 bulletin gave "5, expected to decrease," but things were going from bad to worse all afternoon. At 1800 the K-index was 6 (only a few times in the whole year had a 6 been given) and expected to decrease. It did, eventually, and the worst was over, but the damage had been done to SSers in the latitudes where auroral effects are murder on the lower ham bands. Some planetary configurations to ponder in connection with November, 1975, follow: Jupiter and Saturn were approaching their 90° configuration, and were about 94° in November. Jupiter and Mercury were in 180° relationship on the 14th. Saturn and Mercury were separated by 90° on the 15th. Jupiter-Venus at 90° on the 23rd, and Saturn-Venus lined up on the same heading the 24th may have been factors in some of the less spectacular bumps in the November curves. Keeping up with the Sun Until early this year our viewing of the sun was done with the simplest practical projection setups, to determine if such methods are worth the time they take. We feel they are, particularly if you observe regularly, and keep detailed records. Don't let lack of an expensive telescope keep you from it. Like photography with an aim-and-shoot type of camera, there'll come a time when you want something better, but you can learn plenty with the simple approach. By the end of April, 1976, we'd completed a month using a Celestron 5 telescope, equipped with the maker's solar filter to permit direct viewing. It became apparent at once that this device was going to show us things we'd not have caught before. The central portions of the curves of Fig. 2 record our first real success in this line. There are two striking anomalies immediately apparent, both missed by the forecasters who rely wholly on recurring phenomena. The curves show the last half of one month and the first half of the following one, to get two events on one chart. We will be concerned with the red-line data first, covering April 15 through May 15, 1976, but concentrating on April 27 through May 3, initially. On April 2 we had our first view of a large and active spot group, using the Celestron. It was three days from the west limb. Three other active areas, one representing Cycle 21, were identified before "C1" came around the east limb again, on April 21, our first well-documented recurrence. Our old friend turned out to be a disappointment at first, moving placidly across the solar disk without causing much excitement, seemingly in its declining phase. Then, on the afternoon of April 28, a tail started to grow on a dark area at the center of the spot group. Next morning, clouds prevented early viewing, but we got a look just before noon, and found that an almost incredible change had taken place. Old C1 was now three separate spots, each with its own penumbra, and there were about 12 smaller spots in between and around them. Note that the solar flux curve, Fig. 2A, shows a 7-point rise April 28, that has no preceding or following 27-day counterpart. Then, on the A-index curve, Fig. 2B, 4 days later, we have a bolt-out-of-the-blue disturbance. Punch line for those who don't read astronomy magazines: There was an annular eclipse of the sun over Europe at 0900 April 29! Interesting coincidence No. 2: Jupiter was in 180° alignment with the sun-moon-earth lineup at that time, and still only 4° inside its 90° relationship with Saturn. If you want to go really far-out, Pluto, Uranus, and Saturn were involved in other Nelson configurations. Take your choice of explanations - but this was a major propagation anomaly, centered on an eclipse of the sun, and associated with a 180-degree alignment of the earth and Jupiter, in classic Nelson style. How about the solar flux "mountain range" in Fig. 2A, upper left? March, 1976, is the most disturbed month in our records to date. In the portion shown, there are Nelson configurations between Saturn and Mercury, 3/15; Jupiter-Mercury, 3/16; Mars-Mercury, 3/17; Saturn-Venus, 3/18; Jupiter-Venus, 3/20; Mars-Venus, 3/25 - and Jupiter and Saturn were close to 90° apart the whole month. Note the two huge A-index peaks March 26 and April 2, following the two highest solar-flux peaks at the appropriate times - but having only the vaguest suggestion of 27-day recurring events in April or May. Our final chart, Fig. 3, shows two relatively minor June events, much less spectacular, but perhaps no less revealing, because our notice of these was triggered by what we saw on the sun. Except for an A-index peak at the end of the month, Fig. 3B (no explanation of this, yet), June was relatively quiet. There was little to be seen on the sun, but the several active areas we'd identified previously were discernible as they came around again, mostly much reduced in size and visible activity from previous appearances. On the afternoon of June 8, growing activity was seen in the western quadrant of the sun. There had been no visible activity in this area, for the several days it had been in view previously. Good eyes were needed to see it now, but we have several such pairs at Headquarters, notably those of W1SL and W1YNC. Tom and Tony agreed that something was happening; that there were up to four small spots, and changing fine-detail threads around and between them. The solar flux had been at 66 (the minimum) June 2-34, and 67 the next three days. It rose two points in the next 24 hours, reaching 69 on the early part of the 9th, but then dropping back a notch in the afternoon. This little bump doesn't look like much in the June line of Fig. 3A, but the A-index peak of June 11 may be more significant. Our guess is that we saw the activity which was responsible for the particle emission producing this. The disturbance was strong enough so that Boulder called it a "minor geomagnetic storm," giving its time-spread as 0000 to 1200 UT, the 11th. It was not predicted by anybody, but those of us who saw that burst of activity were pretty sure trouble was coming. The other event of interest in June is represented by the plateau in the solar flux curve, June 16-17-18. This is centered on a 180° alignment of the earth, the sun, and Venus (superior conjunction of Venus) on June 17. Note that the solar flux rose steadily before the conjunction, and then held at 75 from the day before through the day after. It then dropped back a little, only to rise to the month's high, 76, on the 21st. Our old friend, recurring area C1 , was a star performer in this event. Barely visible as it came around the east limb June 15, it expanded markedly in the next three days. By the 18th, sharp eyes could see at least 18 spots, spread over 2 to 3 days' travel time, as the sun rotates - in the eastern quadrant of the sun, which Nelson credits as being the region most likely to affect the earth's ionosphere. A final solar feature for June should bring joy to hungry DXers. As C1 (now losing steam) passed over toward the west limb, new activity began to show on the east limb, far down the disk from the solar equator. This last is significant, as Cycle 20 activity follows the equatorial line closely, and Cycle 21 spots are far removed from it. The new arrival, dubbed C7 on our records, was clearly the largest and most visible activity center of the new cycle yet seen by the writer and cohorts. More important, it was the first Cycle 21 group to last more than 4 days in our sights. It was a well-developed spot, with up to three small followers clearly visible. And it was still essentially the same in appearance on July 2, when it passed over the west limb, after twelve days in sight. We credit it with having contributed to the high solar flux reading of the month, 76, on June 22, at the time of its greatest visible activity. And Now Some Old Stuff
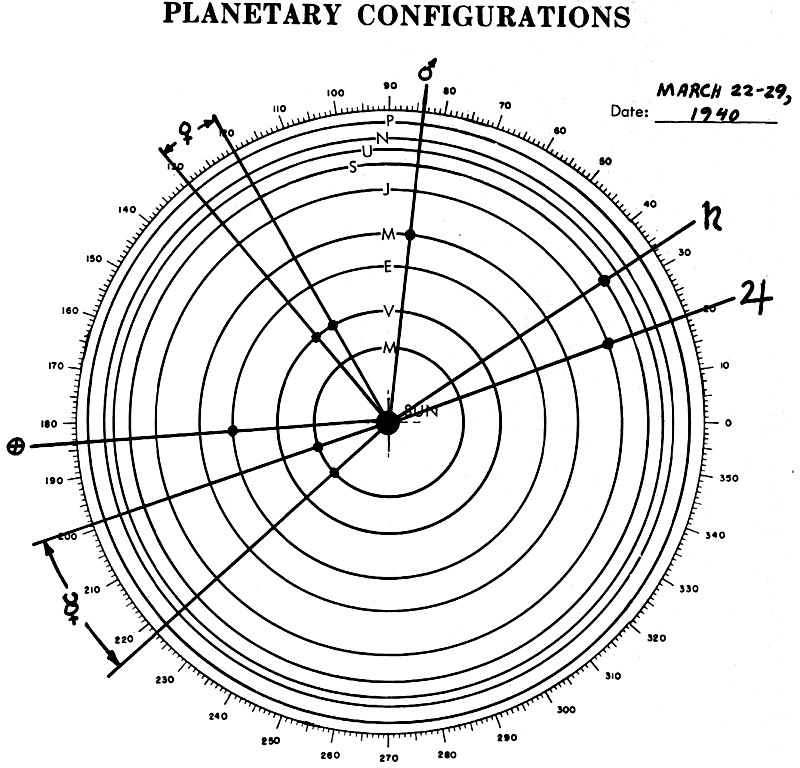
Fig. 4 - Planet plot for the first vhf aurora ever mentioned in QST, also chosen as an example by Nelson.1 Symbols, clockwise from lower left, are for Mercury, Earth, Venus, Mars, Saturn and Jupiter. Movement in the one-week period is shown for Mercury and Venus only. Work-sheet by W2BOC. Many of the examples cited by Nelson in the 1940s were famous days in vhf history, it turns out. This writer was striving to document propagation "firsts" in the new QST vhf column back then, so we checked back to see what we were saying about some of the major disturbed days in Nelson's records. His first was March 24, 1940. In QST for May, "On The Ultra-Highs," as the vhf column was first known, devoted three pages to the aurora events of "the last week of March, 1940 ... probably the most pronounced aurora in the history of uhf communication." But we beat Nelson to it by one month, recounting the fact that February 24 was an aurora date, too, and calling attention to use of the "28-day cycle" in anticipating the March recurrence. Nelson's information shows Mercury and Jupiter in 180-degree configuration March 23 , Venus-Mercury 90° March 25, and Saturn-Mercury 180° March 26-7. Perhaps this explains, after 36 years, why that famous March, 1940, aurora ran on and on, for the better part of a week! A disturbance of September 19, 1941, associated with multiple configurations by Nelson is described by the writer in November, 1940, QST as remarkable for its auroral effects extending down to at least 36° latitude in eastern USA. Some of the first auroral contacts ever made on 144 MHz came on April 12, 1949, coincident with multiple configurations of Mercury, Venus, and Jupiter. We score one on Nelson, here. He didn't mention the moon, but "The World Above 50 Mc." does. The moon was eclipsed the night of April 12, and we took editorial note of the fact in reporting widespread 2- and 6-meter auroral activity in June, 1949, QST. One more eclipse narrative, and we're done. Without associating it in any way with high solar radiation, Nelson excerpts information from a Covington paper that describes use of an eclipse to determine where solar noise is coming from.7 When we saw Covington's date our memory cells really began to spin. There was heavy cloud cover that day in New England, so we paid the eclipse little notice. But we had no trouble remembering what happened the next day. G6DH and W1HDQ had been making daily cross-band checks, 28-50 MHz, for more than a month by then, with no signals heard on the higher frequency. It was just before noon, November 24, 1946, that the frantic voice of G6DH was heard coming back on 10 meters - "I'm hearing you on 50 megacycles - I'm hearing you on 50 megacycles!" The first transatlantic vhf QSO in history had begun. Though we checked daily for months thereafter, it was not until the fall of 1947 that the MUF hit 50 MHz across the North Atlantic again! The writer takes this opportunity to acknowledge the debt all propagation watchers owe Mel Wilson, W2BOC. Jack Power, W2AXU, provided invaluable assistance in many ways, and has kept weekly 50-MHz skeds for over a year to facilitate exchange of information. Tom McMullen, WISL, Brian Machesney, WAI LIR and Tony Dorbuck, W1YNC, have helped to spot faint signs of solar activity for us, time and again. Jerry Hall, KIPLP, kindly made his 5-inch reflector telescope available for months of daily observation of the sun. The work that led to this article is clearly no one-man job. QST Footnotes 1. Nelson, "Shortwave Radio Propagation Correlation with Planetary Positions," RCA Review, March, 1951. Also of interest, by the same author, with Arzinger and Hallborg , "Sunspots and Radio Weather," RCA Review, June, 1948. 2. Wood, "Sunspots and Planets," Nature, Vol. 240 (November, 1972). 3. Okal and Anderson, "On the Planetary Theory of Sunspots," Nature, Vol. 253 (February, 1974). 4. Gribbin and Plagemann, The Jupiter Effect, Walker and Co., 1975. 5. A recent and very useful source of solar system information is the September, 1975, issue of Scientific American. The complete issue is now available in book form from W. H. Freeman and Co., San Francisco. 6. Tilton, "The DXer's Crystal Ball," QST, June, August, and September, 1975. Similar information in The Radio Amateur's Handbook, chapter 19, 1976 and 1977 editions. 7. Covington, "Microwave Solar Noise Observations During the Partial Eclipse of Nov. 23, 1946," Nature, Vol. 159 (March, 1947). * Technical Department, ARRL
Posted September 10, 2020 |
|