Hot and Cold Resistors as UHF Noise Sources |
|
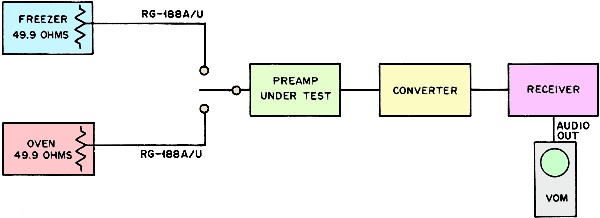
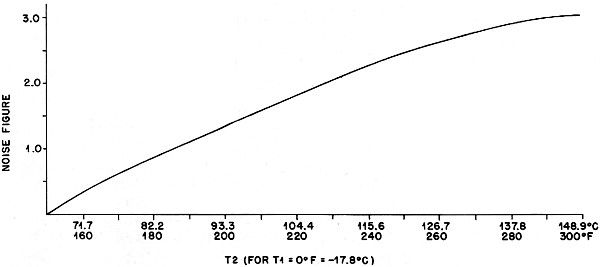
Whether you are new to the subject of noise figure or are just looking for a quick review, this "Hot and Cold Resistors as UHF Noise Sources" article in a 1976 issue of QST magazine is a good source. Author Benjamin Lowe, K4VOW, does a nice job of explaining the concept of electrical noise, and then presenting equations governing the calculation of noise factor and noise figure. Actual numerical examples are provided to demonstrate how the formulas work. Using this method, you can make a fair measurement of the noise figure of a receiver without the need for expensive test equipment. Hot and Cold Resistors as UHF Noise Sources Using the Gaussian Distribution of White Noise Generated by Carbon-Film Devices That Are Subjected to a Thermal Gradient in a Pseudo-Laboratory Environment for Ascertaining the Ability of Quiescent Amplifiers to Resolve Low-Energy Quantum. How's that again? By Benjamin L. Lowe,* K4VOW/WA5UVM Here is a method for obtaining an accurate measurement of the noise performance of your preamplifier. The equipment needed is inexpensive (if you don't have an oven and a freezer, you can get them and split the cost with the household budget). If your wife will not let you into the kitchen, she can make the measurements, even without a cookbook. When a requirement exists to determine the noise figure of an amplifier, it is difficult to obtain an absolute measurement for very low-noise devices. Simple diode noise generators allow the amateur, as well as other designers, to adjust equipment for minimum noise, but the question eventually arises, "How good is the noise figure?" This is a valid question in determining the system capability. Popular automatic noise-figure-measurement systems, which are practically standards in today's electronic industry, can yield errors in the order of 0.5 to 1 dB in some cases, such as 432-MHz preamplifier measurements. It is not meant here to fault such equipment, because very good measurements were obtainable on vacuum-tube amplifiers that had noise figures of 5 to 10 dB. However, a 1-dB error in the measurement of an expected 1.5 -dB noise-figure device can certainly produce disappointing results. This can readily be seen by observing the decrease in the signal-to-noise ratio for a 2.5 dB noise figure preamplifier in a system when a 1.5-dB noise figure is expected. The resulting signal-to-noise ratio decreases about 2 dB at 432 MHz, which is disastrous when only a 3-dB ratio might be expected in the first place! It may be beneficial to make a few comments in laymen's terms on what the noise figure is and why it is important. For any receiver system to produce signals through its audio amplifier, a signal must be applied to the detector that is strong enough, or has enough energy, to operate the detector and, hence, be converted from an rf or i-f signal into an audio signal. In order to produce this necessary signal at the detector, the incoming energy at the antenna terminals must be amplified many times. This is accomplished by the use of preamplifiers, mixers, i-f amplifiers, and sometimes a second or third i-f stage. Different frequencies are used in obtaining the required gain in order that the gain at anyone frequency is not so great that the receiver oscillates. Unfortunately, the devices that provide this amplification also generate noise. At vhf and uhf this noise is usually greater than the atmospheric noise presented to the receiver by the antenna. Hence, the noise generated by the amplifying stages is the limiting factor that must be overcome by the signal. Minimizing this noise reduces the required incoming signal for a given signal-to-noise ratio. The noise figure is simply a measurement of the noise generated, or added, by the amplifiers. The following expression is generally used in calculating noise figure. NF = 10 log FT = 10 log (F1 + F2-1/G1 + F3-1/G1G2+ etc.) where NF = noise figure, total FT = total noise factor F1 = noise factor of the first amplifier stage F2 = noise factor of the second amplifier stage G1 = gain of the first amplifier stage G2 = gain of the second amplifier stage It can be seen that most of the total amplifier noise is generated a the first stage if the gain of the first stage is high enough. This is why a low-noise-figure preamplifier is so important. How Can Noise Figure Be Accurately Measured at Home? In this section the the technique for measuring noise figure is described. For those who are interested, the theory of this approach is discussed in the following section. As is mentioned earlier, any device that amplifies also generates noise. Along with this principle, any device which is at a temperature above absolute 0, T = -273 °C, also generates noise. While it is difficult to measure noise power at low levels, the temperature can be measured. Therefore, a relationship is determined (given in the next section) between the noise figure and the temperature, or equivalent temperature, of a device. This principle is now applied to apparatus for noise-figure measurements that are available to most hams. The scheme utilized here is to adjust the temperature of two resistors to known values, apply the noise power generated from each resistor to the preamplifier stage under test, and determine the noise figure from the resulting increase in noise at the receiver's audio output. Note that the noise power generated by the resistors depends on the temperature of the resistors, not the resistance value. Resistor values close to 50 Ω are used, since this will eventually be the source impedance applied to the preamp by the antenna. The apparatus required to do this are: (1) an oven, such as found in a kitchen, (2) a freezer, (3) a thermometer, (4) a receiver for the frequency under consideration and (5) a VTVM or VOM. Additionally, two 49.9 Ω resistors and two 152.5-cm (5-foot) feed lines are needed that will withstand the operating temperatures to be used. (The XYL is going to be overjoyed to see this ham project headed for the kitchen!) A procedure which can be followed is to connect the two resistors to the two feed lines with as short a lead as possible to minimize the SWR. The freezer is set to -17.8 °C (0 °F) and allowed to stabilize at that temperature. Of course, the thermometer is used to measure this temperature. The test set-up is shown in Fig. 1. Using one of the specified resistors, the resistor and 30.5 cm (1 foot) of feed line are placed inside the freezer. This allows 122 cm (4 feet) of feed line to be outside the freezer to connect to the preamp. Also, a resistor with 30.5 cm of feed line is placed in the oven, leaving 122 cm outside the oven for connection to the preamp. The room temperature, which is the temperature of the feed lilies external to the freezer and the oven, is assumed to be +21 °C (70 °F), T1. It is necessary to operate the receiver in its linear range, i.e. the rf and af gain controls in the linear region and the AVC "off." Also, it is best to connect the VOM or VTVM to a high-impedance point, such as the headphone output, in order to obtain a readable voltage level with the receiver gain set in the linear region. Now place the thermometer in the oven with the hot resistor and begin increasing the oven temperature. The preamplifier is switched back and forth between the hot and cold resistors (noise sources), and the noise voltage is observed on the VOM until the noise from the hot resistor is 1 dB greater than the noise from the cold resistor. Most VOMs have a dB scale which can be used, or the "hot" voltage level should be 1.12 times the "cold" voltage level (20 log 1.12 = 1 dB). When the 1-dB increase in noise power at the receiver output is achieved with the oven temperature stable, quickly remove the thermometer and record the temperature, T2. Be sure to use heat pads (pot holders) because the thermometer is going to be hot. From the graph shown in Fig. 2, use the oven-temperature reading to determine the amplifier noise figure.
Fig. 1 - Noise-figure-measurement test setup.
Fig. 2 - Noise figure vs. "hot" resistor temperature.
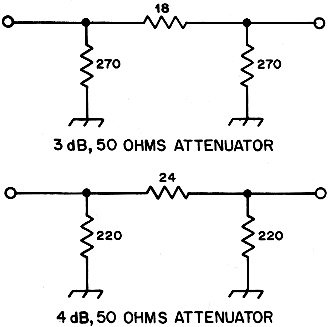
Fig. 3 - Attenuator values. Several points should be noted about this test procedure. One is that precision carbon-film resistors, type RN55C with a value of 49.9 ohms, are used for two reasons: (1) the value changes only about 0.5 ohm at 150 °C, thereby maintaining a good match, and (2) the maximum operating temperature rating of 175 °C (34°F) for the resistors is above the expected oven temperature preventing destruction of the resistor. Other resistors meeting the same criteria can be used. A similar point concerns the type of coax used to connect the resistors to the preamp. Type RG-188A/U semi-rigid can be used up to 200 °C, and its attenuation characteristic, 23 dB/100 ft. (100 ft. = 30.48 meters), is used in deriving the chart in Fig. 2. For resolving any questions about the linearity of the receiver or the accuracy of the VOM, attenuators can be placed between the converter and receiver in the test setup shown in Fig. 1. In this case a given VOM reading could be established with the preamp connected to the "cold" resistor and a 3 dB attenuator between the converter and the receiver. When "hot" resistor measurements are made the attenuator is changed to 4 dB, and the "hot" resistor is heated until the original meter reading is obtained. 3 dB and 4 dB attenuators for 50 Ω are shown in Fig. 3 and can be constructed with 1/4-watt carbon-composition resistors. Even this method isn't completely fool-proof, because a receiver input SWR of 2:1 could change the difference in attenuation between the 3- and 4-dB attenuators to 0.9 dB. The attenuation factor is only completely accurate for matched systems. Theory and Calculations Since not all amateurs will want to produce identical test setups as just described, the method of deriving the graph in Fig. 2 may be of interest. The output noise power from a system with gain and with a source impedance at some temperature is given as N1 = GK (T1 + Te) Bn where N1 = output noise power for temperature T1 G = system gain K = Boltzmann's constant (1.38 X 10⁻²³ joules/degree Kelvin) T1 = temperature of the source impedance Te = equivalent input temperature of the amplifying device Bn = the noise bandwidth Note that the noise power from the input impedance, assumed to be resistive, is N1 = K T1 Bn and the equivalent input noise power for the amplifier is N =K Te Bn By increasing the temperature of the input resistor to T2 the output noise power becomes N2 = GK (T2 + Te) Bn Now, suppose we wanted to measure a difference between the output powers of 1 dB. Hence, 10 log N2/N1 = 1 dB and N2/N1 = 126 = [GK (T2 + Te) Bn]/[GK (T1 + Te) Bn] yielding Te = (T2 - 1.26 T1)/0.26 Also, a power ratio of 1.26:1 is a voltage ratio of 1.12:1. T2 and T1 would be the temperatures of the hot and cold resistors if we could connect our amplifier directly to the resistors. But, since we must use a length of feed line that has some loss, the equivalent temperature including that feed line must be determined. The type of line chosen, so as not to melt, is RG-188A/U semi-rigid coax. This cable has a loss factor of 23 dB/100 ft. (0.755 dB/m) at 432 MHz. Now, it is assumed that 152.5 cm (5 ft.) will be used to connect the resistor to the input of the preamp. Furthermore, it is assumed that 30.5 cm (1 ft.) will be inside the freezer or the oven at the same temperature as the resistor, and the remainder, 122 cm (4 ft.) will be outside the oven at room temperature, 21.1 °C (70 °F or 294.1 °K). Now we can determine the equivalent noise temperature of the resistor as viewed looking through the coax. This temperature, now defined as T1, is T1 = Tr1 + Te1 + Te2/G1 where Tr1 = the resistor temperature in °K Te1 = the equivalent temperature of the 30.48 cm (1 ft) of line in the temperature chamber Te2 = the equivalent temperature of the 122 cm (4 ft) of line outside the temperature chamber G1 = the gain (in this case, the loss) of feed line in the temperature chamber Also Te1 = (L1 - 1)TL1 where L1 = the feed-line loss for 30.48 cm TL1 = the actual temperature of the length L1 in °K and Te2 = (L2 - 1)TL2 where L2 = the feed-line loss for 122 cm TL2 = the actual temperature of the length L2 in °K A calculation is now made to determine one point for the curve in Fig 2. The resistor temperature, Tr1, and the 30.48-cm feed-line loss is 0.23 dB = 1.055 = L1. So, Te1 = (L1 - 1) TL1 = (1.055 - 1) 255.2 °K Te1 = 13.88 °K and Te2 = (L2 - 1) TL2 = (1.236 - 1) 294.1 °K = 69.41 °K for TL2 = 21.1 °C=70 °F So T1 = 255.2 °K + 13.88 °K + 1.055 (69.41 °K) = 342.33 °K Similarly, for the hot resistor at a temperature of 93.3 °C = 200 °F and feed line connected to that resistor T2 = 366.3 °K + (1.055 - 1) 366.3 °K + 1.055 (1.236 - 1) 294.1 °K = ( 459.7 °K - (1.26) (342.33 °K) )/0.26 Knowing T1 and T2, the equivalent noise temperature for a 1-dB increase in output noise power is Te = 459.7 °K Te = 109.1 °K From this temperature the noise figure is calculated from: Te = (F - 1) T0 where F = noise factor T0 = 290 °K, IEEE definition For Te = 109.1 °K F= Te/T0 +1 = 109.1 °K/290 °K +1 = 1.38. and NF = 10 log F = 1.39 dB where NF = noise figure If an error in the measurements of the temperature was made (for example, the "cold" resistor was actually 2.77 °C (5 °F) lower than measured and the "hot" resistor was 2.77 °C (5 °F) higher than measured), the resulting noise-figure error would be in the order of 0.2 dB. It is felt that most amateurs can make temperature measurements at least this accurate, and consequently, obtain a noise-figure reading very close to the actual noise figure. * Stanford Research Institute, 306 Wynn Dr., Huntsville, AL 35805
Posted October 8, 2020 |
|