Sound | Audio | Music Infographic
|
|
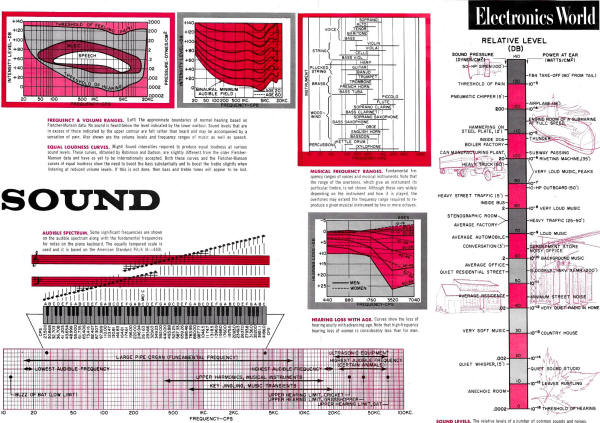
The August 1962 issue of Electronics World magazine featured what could be considered as an early "infographic" on the topic of sound, music, and audio. Frequency and volume, perceived equal loudness levels, the audible frequency spectrum, musical frequency ranges, typical age-related hearing loss, relative sound levels in decibels, and the musical scale are included. The sound power level chart ranges from the threshold of hearing value of 10-16 watts/cm2 (0 dBA) to standing 80 feet from the tail of a North American F-86 Sabre Jet taking off, which is a couple dB above the threshold of pain at 10-3 watts/cm2 (130 dBA). The charts were useful (and still are for that matter) to the audiophiles who looked to electronics magazines of the era for technical information. BTW, the loudest possible sound pressure level is around 191 dBA, whereafter it is into the shock wave realm of sound pressures. Sound | Audio | Music Infographic Frequency & Volume Ranges The approximate boundaries of normal hearing based on Fletcher-Munson data. No sound is heard below the level indicated by the lower contour. Sound levels that are in excess of those indicated by the upper contour are felt rather than heard and may be accompanied by a sensation of pain. Also shown are the volume levels and frequency ranges of music as well as speech. Equal Loudness Curves Sound intensities required to produce equal loudness at various sound levels. These curves, obtained by Robinson and Dadson, are slightly different from the older Fletcher-Munson data and have as yet to be internationally accepted. Both these curves and the Fletcher-Munson curves of equal loudness show the need to boost the bass substantially and to boost the treble slightly when listening at reduced volume levels. If this is not done, then bass and treble tones will appear to be lost. Audible Spectrum Some significant frequencies are shown on the audible spectrum along with the fundamental frequencies for notes on the piano keyboard. The equally tempered scale is used and it is based on the American Standard Pitch (A=440). Musical Frequency Ranges Fundamental frequency ranges of voices and musical instruments. Note that the range of the overtones, which give an instrument its particular timbre, is not shown. Although these vary widely depending on the instrument and how it is played, the overtones may extend the frequency range required to re-produce a given musical instrument by two or more octaves. Hearing Loss with Age Curves show the loss of hearing acuity with advancing age. Note that high-frequency hearing loss of women is considerably less than for men. Sound Levels The relative levels of a number of common sounds and noises.
Posted May 18, 2021 |
|

