Module 21 - Test Methods and Practices |
||||||||||||||||||||||||||||||||||||||||||||||||||
|
Module 21 − Test Methods and Practices
Pages i , 1−1, 1−11, 1−21, 2−1, 2−11, 2−21, 2−31, 2−41, 3−1, 3−11, 3−21, 3−31, 4−1, 4−11, 5−1, 5−11, 5−21, 5−31, AI−1 to AI−3, Index
peak and average power. The principles of radar are covered in NEETS, Module 18, Radar Principles, which can be consulted for an explanation of pulsed waves.
Rectangular Pulse
A rectangular wave is used to pulse-modulate the constant frequency RF carrier to produce the pulse radar output. The rectangular wave is made up of a fundamental frequency and its combined odd and even harmonics. Figure 5-21 shows the development of a rectangular wave.
Figure 5-21. - Rectangular pulse.
Pulsed Wave Analysis
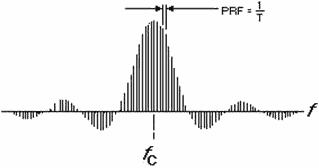
In amplitude modulation, sidebands are produced above and below the carrier frequency. a pulse is also produced above and below the carrier frequency, but the pulse is made up of many tones. These tones produce multiple sidebands that are commonly referred to as SPECTRAL Lines, or RAILS, on the spectrum analyzer display. Twice as many rails will be in the pulse-modulated output of the radar as there are harmonics contained in the modulating pulse (upper and lower sidebands), as shown in figure 5-22. In the figure, the pulse repetition frequency (prf) is equal to the pulse interval of 1/T. The actual spectrum analyzer display would show the lower lobes (shown below the reference line in the figure) on top because the spectrum analyzer does not retain any polarity information. Changing the pulse interval, or pulse width, of the modulation signal will change the amount of rails (prf), or number of lobe minima, as illustrated in figure 5-23.
5-21
Figure 5-22. - Pulsed radar output.
Figure 5-23. - Pulsed radar changes caused by modulating signal changes.
ANALYZING The SPECTRUM Pattern
The leading and trailing edges of the radiated pulse-modulated signal must have a sharp rise time and decay time and a constant amplitude between them. Incorrect pulse shape will cause frequency spread and pulling, which results in less available energy at the frequency to which the receiver is tuned. The primary reason for analyzing the spectrum is to determine the exact amount of amplitude and frequency modulation present. The amount of amplitude modulation determines the increase in the number of sidebands within the applied pulse spectrum; an increase in frequency modulation increases the amplitude of the side-lobe frequencies. In either case, the energy available to the main spectrum lobe is decreased.
5-22 SPECTRUM ANALYZER Operation
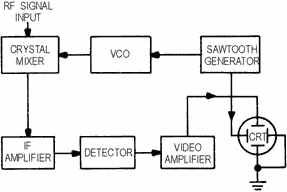
The information desired from the spectra to be analyzed determines the SPECTRUM ANALYZER requirements. Real-time analysis is used if a particular point in the frequency spectrum is to be analyzed, such as a line spectra display. Continuous- or swept-frequency analysis, which is the most common mode of observation, is used to display a wider portion of the frequency spectrum or (in some cases) the entire range of the spectrum analyzer in use. Changing the spectrum analyzer setting from one mode to another is accomplished by varying the scan time and the bandwidth of the spectrum analyzer or a combination of the two. Most real-time spectrum analyzers, however, are preceded by mechanical filters, which limit the input bandwidth of the spectrum analyzer to the desired spectra to be analyzed. Tunable- or swept- spectrum analyzers function basically the same as heterodyne receivers, the difference being that the local oscillator is not used but is replaced by a voltage-controlled oscillator (vco). The vco is swept electronically by a ramp input from a sawtooth generator. The output of the receiver is applied to a crt, which has its horizontal sweep in synchronization with the vco. The lower frequency appears at the left of the crt display. As the trace sweeps to the right, the oscillator increases in frequency. Figure 5-24 is a block diagram of a heterodyne spectrum analyzer.
Figure 5-24. - Block diagram of a heterodyne spectrum analyzer.
Before the frequency of a signal can be measured on a spectrum analyzer, it must be RESOLVED. Resolving a signal means distinguishing it from other signals near it. Resolution is limited by the narrowest bandwidth of the spectrum analyzer because the analyzer traces out its own IF bandwidth shape as it sweeps through a signal. If the narrowest bandwidth is 1 kilohertz, the nearest any two signals can be, and still be resolved, is 1 kilohertz. Reducing the IF bandwidth indefinitely would obtain infinite resolution except that the usable IF bandwidth is limited by the stability of the spectrum analyzer. The smaller the IF bandwidth, the greater the capability of the analyzer to resolve closely spaced signals of unequal amplitudes. Modern spectrum analyzers have been refined to the degree that IF bandwidths are less than 1 hertz.
It is important that the spectrum analyzer be more stable in frequency than the signals being measured. The stability of the analyzer depends on the frequency stability of its vco. Scan time of the spectrum analyzer must be long enough, with respect to the amplitude of the signal to be measured, to allow the IF circuitry of the spectrum analyzer to charge and recover. This will prevent amplitude and frequency distortion.
5-23 Q-7. When referring to spectrum analyzers, what is meant by the term resolving signals?
TIME-DOMAIN REFLECTOMETRY
TIME-DOMAIN REFLECTOMETRY is a testing and measurement technique that has found increasing usefulness in testing transmission lines (both metallic and fiber-optic), cables, strip lines, connectors, and other wideband systems or components. Basically, time-domain reflectometry is an extension of an earlier technique in which reflections from an electrical pulse were monitored to locate faults and to determine the characteristics of power transmission lines. You can compare time-domain reflectometry to a closed-loop radar system in which the transmitted signal, a very fast step pulse, is fed into the system and the reflections resulting from discontinuities or impedance deviations in the system are monitored on a CRT.
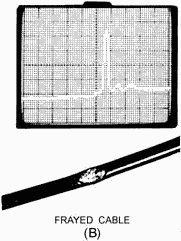
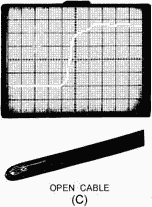
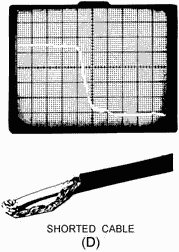
The technique used in time-domain reflectometry consists of feeding an impulse of energy into the system and then observing that energy as it is reflected by the system at the point of insertion. When the fast-rise input pulse meets with a discontinuity or impedance mismatch, the resultant reflections appearing at the feed point are compared in phase, time, and amplitude with the original pulse. By analyzing the magnitude, deviation, and shape of the reflected waveform, you can determine the nature of the impedance variation in the transmission system. Also, since distance is related to time and the amplitude of the reflected step is directly related to impedance, the comparison indicates the distance to the fault as well as the nature of the fault. Figure 5-25, view A, view B, view C, and view D, illustrates typical transmission line problems that can easily be identified by using a time-domain reflectometer (tdr). In addition to showing both the distance to and the nature (resistive, inductive, or capacitive) of each line discontinuity, time-domain reflectometry also reveals the characteristic impedance of the line and indicates whether losses are shunt or series. They are also used to locate and analyze connectors and splices.
Figure 5-25A. - Time-domain reflectometer display of transmission line problems.
5-24
Figure 5-25B. - Time-domain reflectometer display of transmission line problems.
Figure 5-25C. - Time-domain reflectometer display of transmission line problems.
5-25
Figure 5-25D. - Time-domain reflectometer display of transmission line problems.
A conventional method of evaluating high-frequency transmission systems and components has been through the use of standing wave ratio (swr) measurements to obtain an overall indication of transmission line performance. This method involves feeding a sine-wave signal into the system and measuring the maximum and minimum amplitudes of the standing waves that result from system discontinuities or load mismatches. The ratio between the minimum and maximum swr values is then taken as the system FIGURE of MERIT. The swr measurement, however, does not isolate individual discontinuities or mismatches when multiple reflections are present; it only indicates their total effect. Time-domain reflectometry measurements, on the other hand, isolate the line characteristics in time (location). As a result, multiple reflections resulting from more than one discontinuity or impedance variation that are separated in distance on the line are also separated in time at the monitoring point and can be individually analyzed.
Prior to the advent of time-domain reflectometers, time-domain reflectometry was performed with the aid of sampling oscilloscopes and pulse generators with very fast rise times.
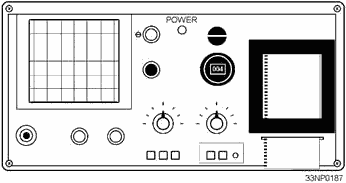
Figure 5-26 shows the earlier type of test setup, which is still an option. However, today's time- domain reflectometers have several advantages over the old pulse-generator and oscilloscope methods. Modern time-domain reflectometers are compact, lightweight, are often supplied with battery pack options for field use, and provide a direct readout of distances instead of time. Some equipments provide a paper-tape recording for a permanent record. Figure 5-27 shows a typical time-domain reflectometer.
5-26
Figure 5-26. - Time-domain reflectometry, basic equipment setup.
Figure 5-27. - Typical time-domain reflectometer.
Q-8. Why are time-domain reflectometers often compared to a radar system?
Q-9. What is the main advantage of using a time-domain reflectometer (TDR) to test a transmission line?
SWEPT-Frequency TESTING Equipment
SWEPT-Frequency testing is used to determine the bandwidth, alignment, frequency response, impedance matching, and attenuation in various circuits, systems, and components. Swept-frequency testing can be used to quickly determine the broadband response of a device that otherwise would require a number of separate measurements and manual plotting of the response curve. Swept-frequency
5-27 techniques are applicable over the entire electronic spectrum from VLF to EHF and are generally limited only by your resourcefulness and the basic limitation of the equipment employed. The basic swept- frequency arrangement is shown in figure 5-28.
Figure 5-28. - Frequency-response test.
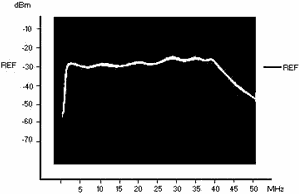
The swept-frequency technique can effectively determine the frequency response of an amplifier or filter and is useful in the alignment or bandwidth determination of an IF or RF stage. The test equipment permits direct visual readout on the CRT of the spectrum analyzer. The spectrum analyzer can also be connected to an X-Y chart recorder if a permanent record or print is desired. Figure 5-29 shows a spectrum analyzer CRT display of the frequency response of a multicoupler. The tracking generator used must be capable of sweeping the desired frequency range of the device under test.
Figure 5-29. - Typical spectrum analyzer frequency-response display.
5-28 Q-10. What is the purpose of swept-frequency testing?
TRACKING GENERATOR
Figure 5-30 shows a typical tracking generator used with the Hewlett-Packard 141 T spectrum analyzer. a TRACKING GENERATOR is basically a sweep generator in which the sweep rate is matched to that of the spectrum analyzer. The output circuitry of the tracking generator contains a network that ensures a constant output amplitude over the entire range being swept. When the fm signal produced by the tracking generator is applied to a device or circuit under test, the instantaneous output amplitude is always proportional to the response of the circuit to the frequency at that instant. Thus, the original fm input signal is changed in passing through the circuit under test. The output signal, therefore, would consist of an fm signal that is also amplitude-modulated. For equal deviations, the positive and negative portions of this envelope are symmetrical, making it necessary to observe only one side of the envelope. After the detection stage in the spectrum analyzer, only the modulation remains to appear on the face of the CRT. This presentation will appear as a continuous curve because of the persistence of vision and the phosphor characteristic of the CRT. The polarity of the detector determines whether a positive or a negative output is displayed. The frequency at any point on the CRT display can be analyzed by arresting the scan of the spectrum analyzer either electronically or manually at the point of interest. For greater accuracy in frequency determination, a frequency counter may be attached to the output of the tracking generator at the point of the arrested scan.
Figure 5-30. - Tracking generator used with a spectrum analyzer.
Impedance MATCHING
Conventional tuners cannot be used successfully to cancel source or load reflections in swept- frequency measurements. This is because the tuning is effective only at single frequencies; therefore, pads
5-29 or isolators are required. However, by the use of automatic-level control, the power output of the sweep generator can be maintained relatively constant at the point of measurement. The source impedance may thus be maintained very close to the nominal value. With this arrangement, any impedance variation in the connecting cables, connectors, and adapters is effectively cancelled since these components are within the leveling loop. The attenuation of a device under test will be displayed on the associated CRT as a continuous response curve as it is scanned. This will result in an attenuation versus frequency plot of the device under test only.
Impedance
Circuit impedance is measured conveniently by using the reflectometer principle. The individual values of the incident and reflected signals (SWR) in a transmission line feeding an unknown impedance are measured. The ratio between these signals indicates how closely the load impedance matches that of the transmission line.
Another method is the use of an auto-mechanical load control to hold the forward power at a constant level while the return load of a specific load is measured. a short is then placed in the circuit, and 100% reflected power is measured. The loss detected is then calculated to obtain SWR figures.
NOIsE FIGURE
By using a frequency-sweeping receiver and an automatic noise-figure meter, you can make noise- figure measurements on broadband microwave devices, such as a traveling-wave-tube amplifier. To conduct such a test properly, you must first check the receiver noise figure.
Q-11. In swept-frequency testing the impedance of a transmission line, what electrical characteristic is actually being measured?
SWEEPING Antennas
Antenna system testing is one of the more common and useful applications for using the swept- frequency technique. The main parameters that an antenna system is tested for are VSWR, frequency response, and impedance. Figure 5-31 shows a typical test setup for testing a transmitting antenna for VSWR. Remember that any transmitting antenna can also act as a receiving antenna and send induced power from adjacent antennas back to the test equipment. You should make an initial power check on the antenna to prevent damage to your test equipment. Figure 5-32 shows a typical HF transmitting antenna VSWR display as measured using the swept-frequency technique. The setup for testing a receiving antenna VSWR, shown in figure 5-33, is similar, with the exception of the attenuators. The measured VSWR (within the operating frequency range) of any broadband antenna should not exceed a VSWR of 2.5 to 1. The VSWR for any single-tuned antenna should not exceed 1.5 to 1 at the tuned frequency.
5-30
|
||||||||||||||||||||||||||||||||||||||||||||||||||


