3D Smith Chart™ v1.02 Release Now Available |

Press Release Archives: 2024 | 2023 | 2022 | 2021 |2020 2019 | 2018 | 2017 | 2016 | 2015 2014 | 2013 | 2012 | 2011 | 2010 2009 | 2008 | 2007 | 2006 | 2005 Content is copyright of company represented. Page format, custom text and images are RF Cafe copyright - do not distribute.
Dr. Andrei Muller, progenitor of the world's first 3D Smith Chart™ software program, has teamed with a handful of able colleagues to release a commercial version of this paradigm-changing design and analysis tool. The following press release was issued on July 17, 2019.
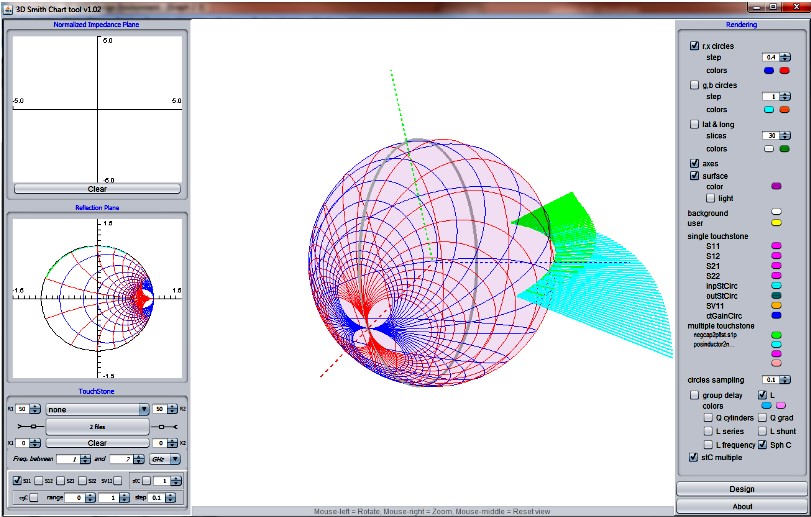
Example of one of these new features showing a 3D frequency sweep representation over S11. The paths of the 2 nH inductor and −2 pF capacitor represented between 1 and 3 GHz.
3D Smith Chart representation for the shunt inductance and quality factor for different inductors within 1-16 GHz. As the inductance becomes negative it enters the 3D Smith Chart interior. The quality factor is represented as a generalized cylinder for each frequency point around the corresponding inductance Many New Features Added 3D Smith Chart™ announces a new version (1.02) of the 3D Smith Chart with new features. The original 3D Smith Chart tool (version 1.01) extended the Smith Chart capabilities for the first time since the 1939s to make it usable for circuits with negative resistance based on a unit sphere that plots circuits with reflection coefficient magnitudes larger than 1 by mapping them as arcs on the 3D sphere. The South represents active areas with negative resistance, North areas represent passive with positive resistance, East inductive, and West capacitive. (North Pole: perfect match, South Pole infinite mismatch). Now, based on the preprint article entitled "Reconfigurable radiofrequency electronic functions designed with 3D Smith Charts in Metal-Insulator-Transition Materials," several new features have been added to the 3D Smith Chart version 1.02, Windows 64-bit compatible tool. The new features include:
The tool is well suited for amplifier stability analysis, oscillator design, filters and group delay analysis. Visit www.3dsmithchart.com for more information and for ordering: http://3dsmithchart.com/#quote Click here to view the 3D Smith Chart v1.02 User's Guide. A video demonstrating new release (3D Smith Chart v1.02) is posted on YouTube:
3D Smith Chart™ Team Members - Andrei A. Muller (PhD), Telecommunications engineer - Alin Moldoveanu (PhD), Computer Science engineer - Victor Asavei (PhD), Computer Science engineer - Cristian Fleischer, Software Engineer
Contact Info Dr. Andrei Muller 3D Smith Chart E-Mail: contact@3dsmithchart.com Web: 3dsmithchart.com Phone: +3471173741
Posted July 18, 2019 |